This is a light wrapper around patchwork::wrap_plots() to
arrange the plots and patchwork::plot_annotation() to
optionally tag levels in the grid of plots.
Arguments
- x
a list of plots.
- ncol
passed to
patchwork::wrap_plots().- tag_levels
passed to
patchwork::plot_annotation().- ...
passed to
patchwork::wrap_plots().
Examples
data <- pmplots_data_obs()
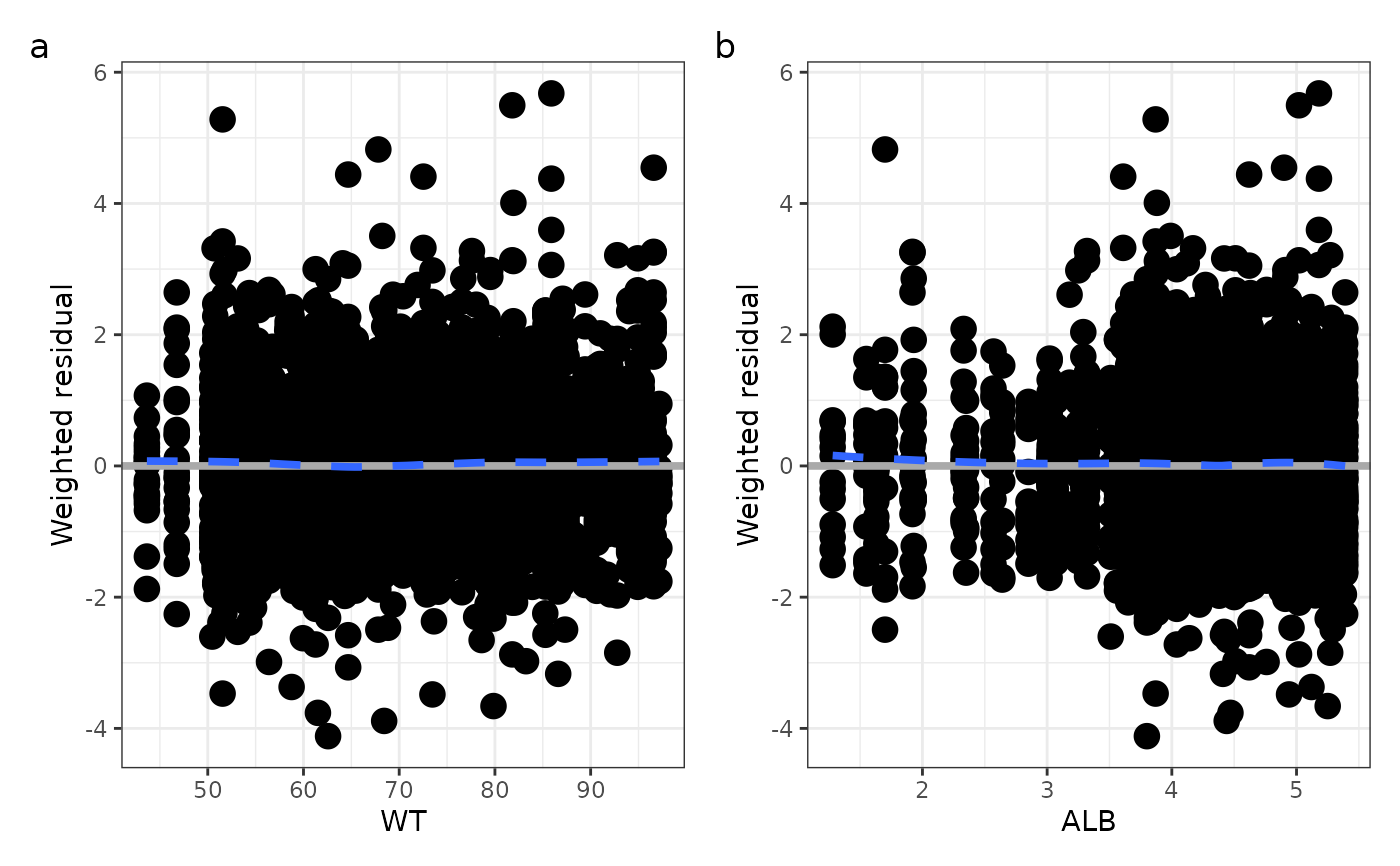
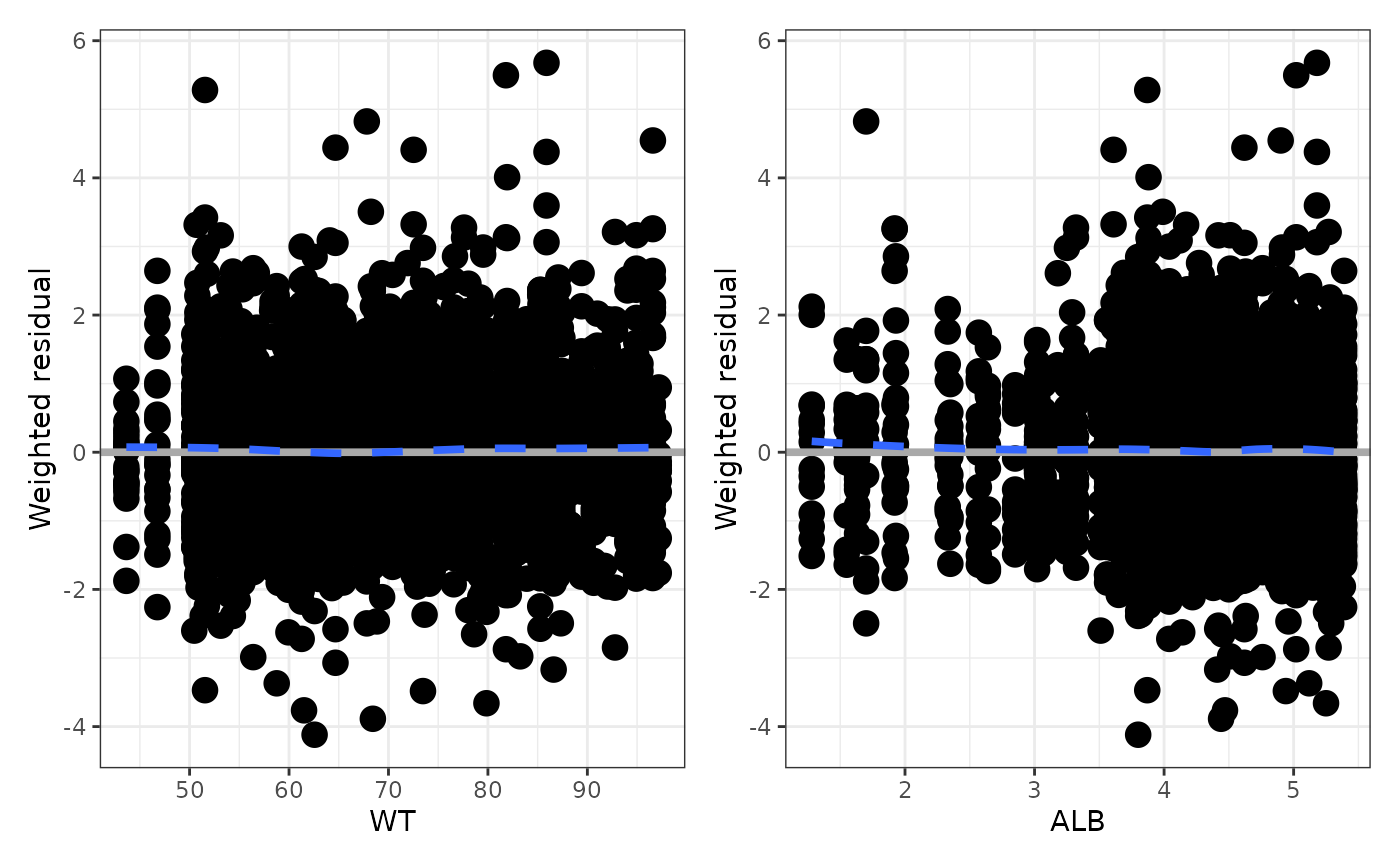
plot <- wres_cont(data, x = c("WT", "ALB"))
pm_grid(plot)
#> `geom_smooth()` using formula = 'y ~ x'
#> `geom_smooth()` using formula = 'y ~ x'
 pm_grid(plot, tag_levels = "a")
#> `geom_smooth()` using formula = 'y ~ x'
#> `geom_smooth()` using formula = 'y ~ x'
pm_grid(plot, tag_levels = "a")
#> `geom_smooth()` using formula = 'y ~ x'
#> `geom_smooth()` using formula = 'y ~ x'