
Split a data frame on a single factor and create a plot from each chunk.
Each plot is labeled with the value of sp using ggplot2::facet_wrap().
See examples.
Arguments
- df
Data frame to split and plot.
- fun
Function to use to plot.
- sp
Character name of column to split; if
dfis a grouped data frame, leave this argument missing and the; regardless of how this is specified,spshould name a single column split column will be determined from the groups.- labeller
A labeller to pass to
ggplot2::facet_wrap(); by default, the value is printed on the strip withlabel_tex().- ...
passed to
fun
Examples
df <- pmplots_data_obs()
require(dplyr)
#> Loading required package: dplyr
#>
#> Attaching package: ‘dplyr’
#> The following objects are masked from ‘package:stats’:
#>
#> filter, lag
#> The following objects are masked from ‘package:base’:
#>
#> intersect, setdiff, setequal, union
df %>% group_by(STUDYc) %>% split_plot(dv_pred)
#> $SAD
#> `geom_smooth()` using formula = 'y ~ x'
#> Warning: Removed 1 row containing missing values or values outside the scale range
#> (`geom_smooth()`).
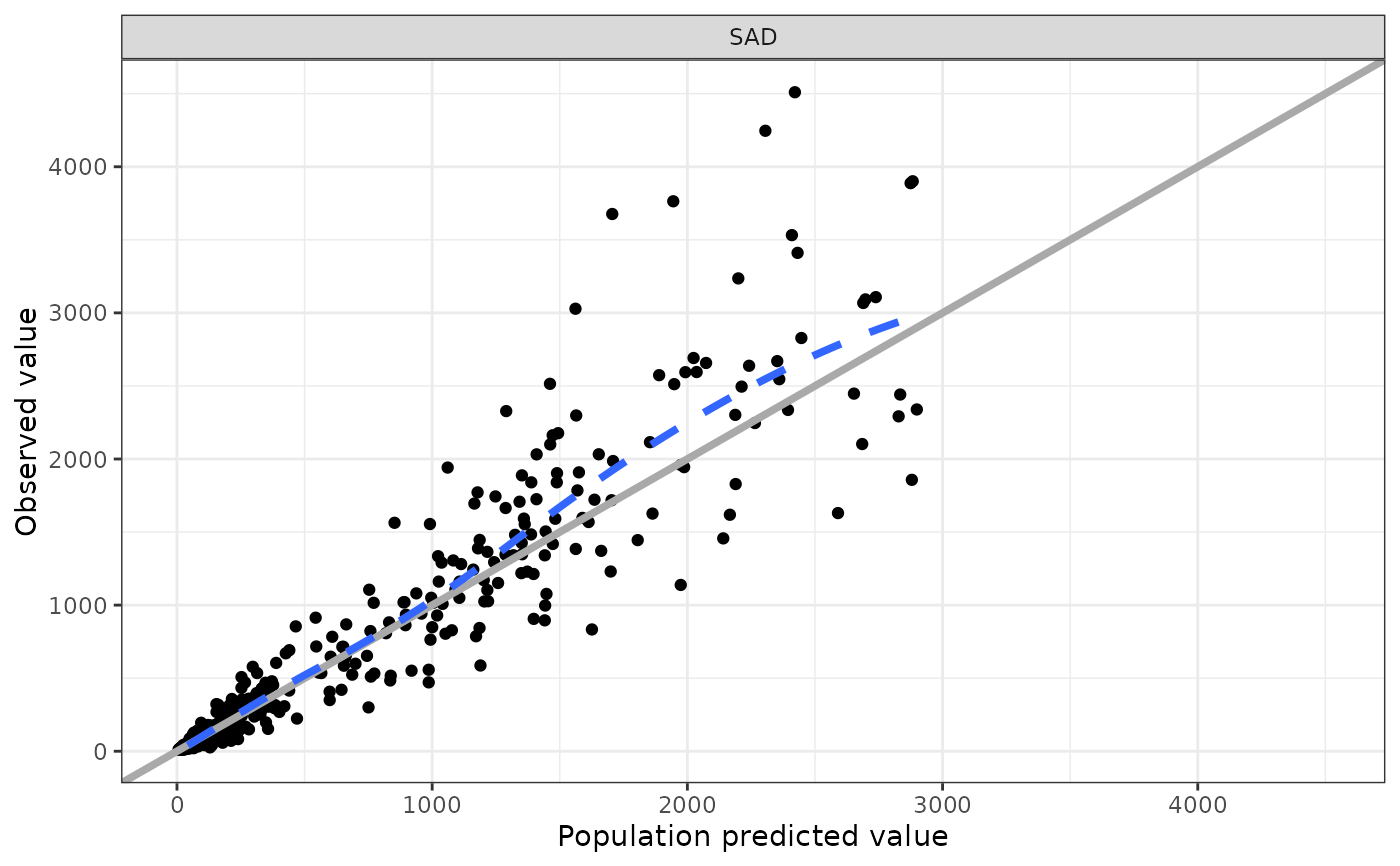 #>
#> $MAD
#> `geom_smooth()` using formula = 'y ~ x'
#>
#> $MAD
#> `geom_smooth()` using formula = 'y ~ x'
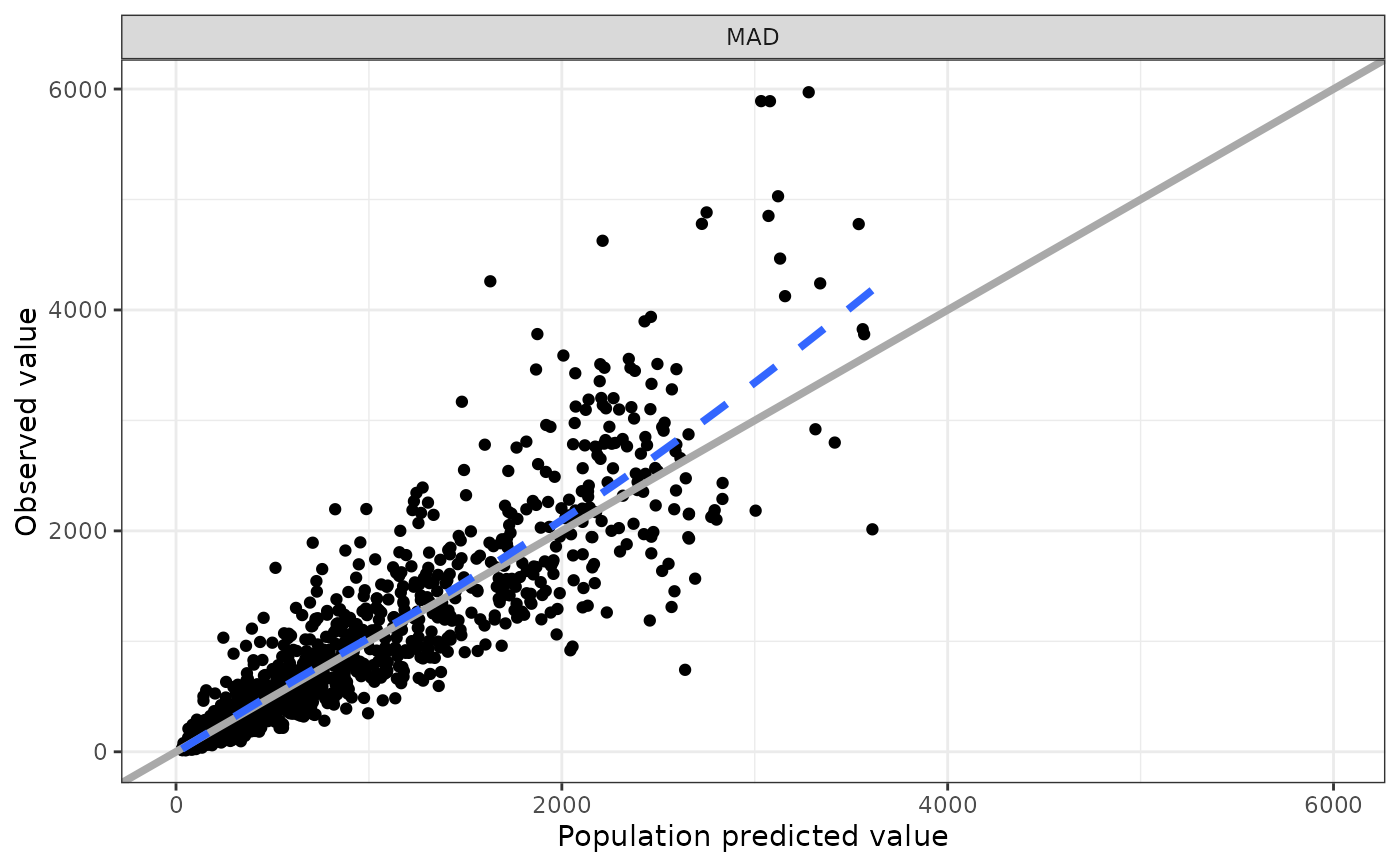 #>
#> $Renal
#> `geom_smooth()` using formula = 'y ~ x'
#>
#> $Renal
#> `geom_smooth()` using formula = 'y ~ x'
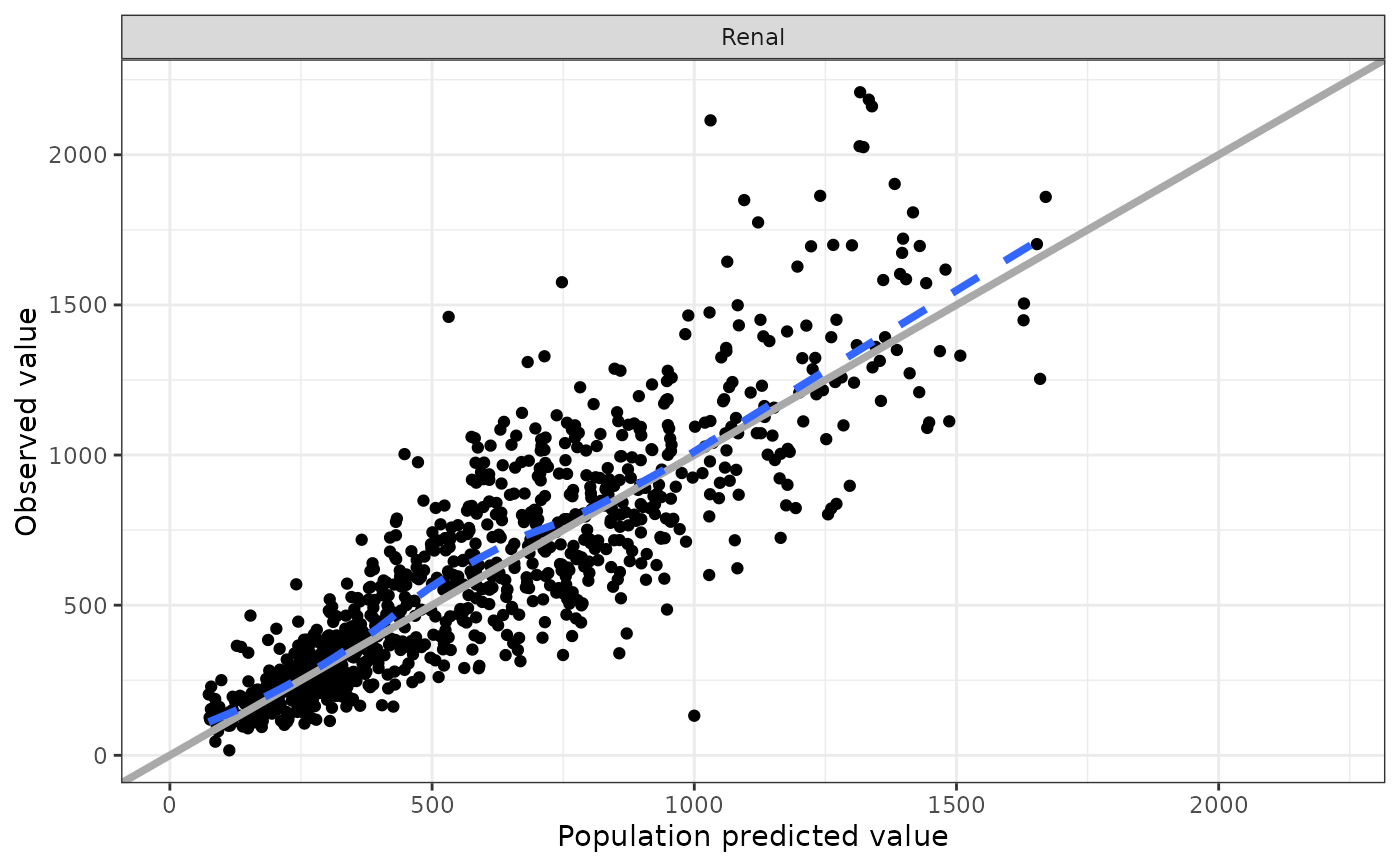 #>
#> $Hepatic
#> `geom_smooth()` using formula = 'y ~ x'
#>
#> $Hepatic
#> `geom_smooth()` using formula = 'y ~ x'
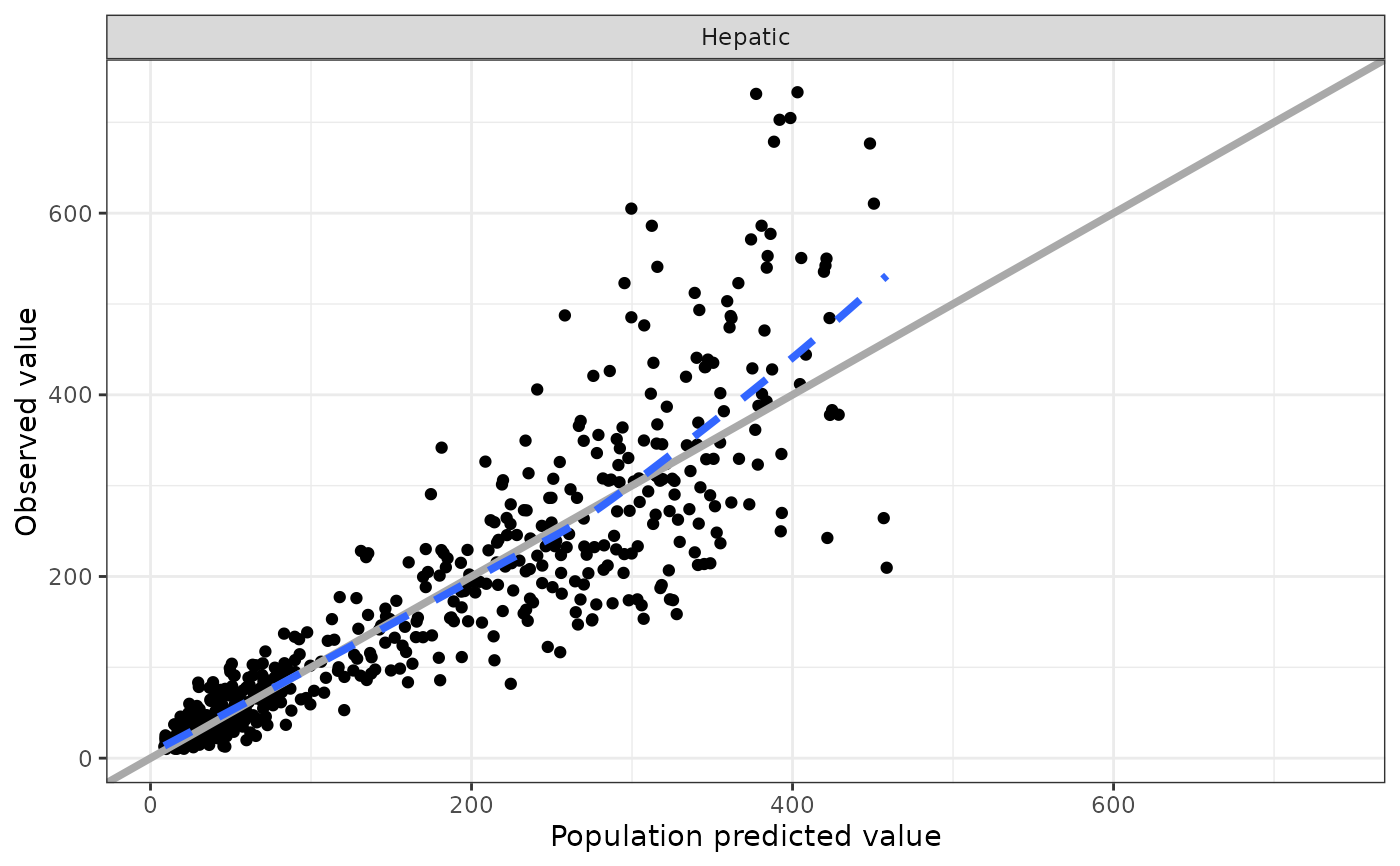 #>
#>