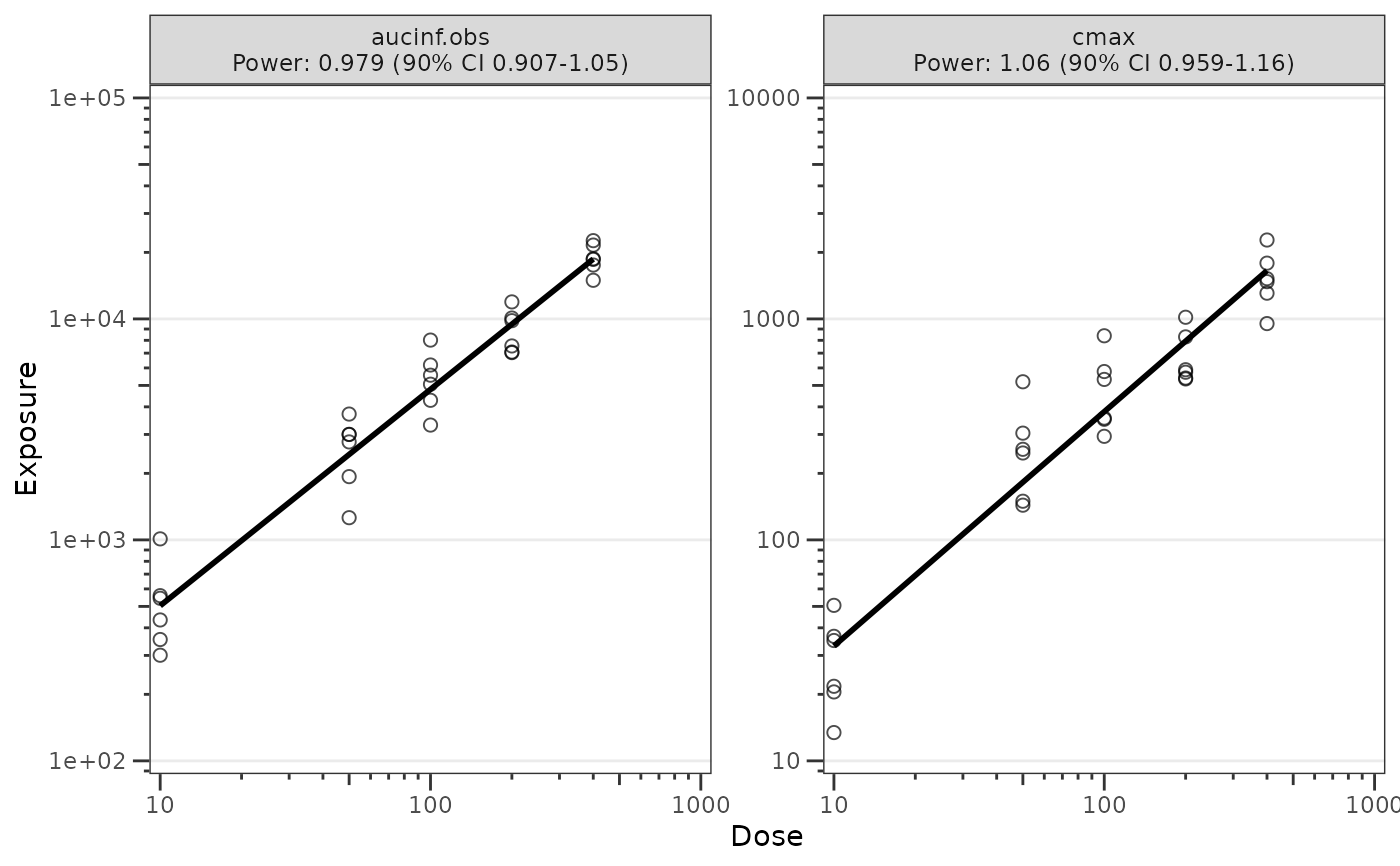
Plot a dose-proportionality assessment via power law (log-log) regression
Source:R/plot_doseprop.R
plot_doseprop.RdDual-mode wrapper that delegates to df_doseprop() for computation and
plot_build_doseprop() for rendering. Accepts either:
raw observation data (e.g. PKNCA output) plus a
metricsvector — the common one-shot mode; ora precomputed
doseprop_statsobject returned bydf_doseprop()— skip the regression refit and replot with differentstyle/sesettings.
On the precomputed path, pipeline arguments (metrics, metric_name_var,
metric_value_var, dose_var, method, ci, sigdigits) cannot be honored
because the regression does not run again — passing any of them aborts
with a message pointing the caller at df_doseprop(). Only style and
se are accepted on both paths.
Usage
plot_doseprop(
  data,
  metrics = NULL,
  metric_name_var = "PPTESTCD",
  metric_value_var = "PPORRES",
  dose_var = "DOSE",
  method = "normal",
  ci = 0.9,
  sigdigits = 3,
  se = TRUE,
  style = NULL
)
Arguments
- data
Either raw observation data (data.frame, default expected format is output from
PKNCA::pk.nca()) or adoseprop_statsobject returned bydf_doseprop().- metrics
character vector of exposure metrics in
datato plot. Required on the raw-data path; ignored whendatais adoseprop_statsobject.- metric_name_var
Column in
datacontaining the metric names listed inmetrics. Accepts bare names or strings. Default isPPTESTCD.- metric_value_var
Column in
datacontaining the exposure metric values (dependent variable). Accepts bare names or strings. Default isPPORRES.- dose_var
Column in
datacontaining the dose (independent variable). Accepts bare names or strings. Default isDOSE.- method
character string specifying the distribution to be used to derive the confidence interval. Options are
"normal"(default) and"tdist".- ci
confidence interval to be calculated. Options
0.90(default) and0.95.- sigdigits
number of significant digits for rounding.
- se
logical to display confidence interval around regression. Default is
TRUE.- style
A
ggstylekit::style_spec()controlling plot aesthetics. Defaults tostyle_doseprop(); view the defaults by runningstyle_doseprop()with no arguments. Customize by passingstyle = style_doseprop(...), or restyle the returned plot withrestyle_plot(). The per-metric facet layout is taken from the style'sfacet_scales(default"free"),facet_nrow, andfacet_ncol; thefacet,logx, andlogyfields are ignored because the builder sets the facet and log-log axes itself.
See also
Other dose proportionality:
df_doseprop(),
is_doseprop_stats(),
plot_build_doseprop(),
style_doseprop()
Examples
# Raw-data path
plot_doseprop(dplyr::filter(data_sad_nca, PART == "Part 1-SAD"),
metrics = c("aucinf.obs", "cmax"))
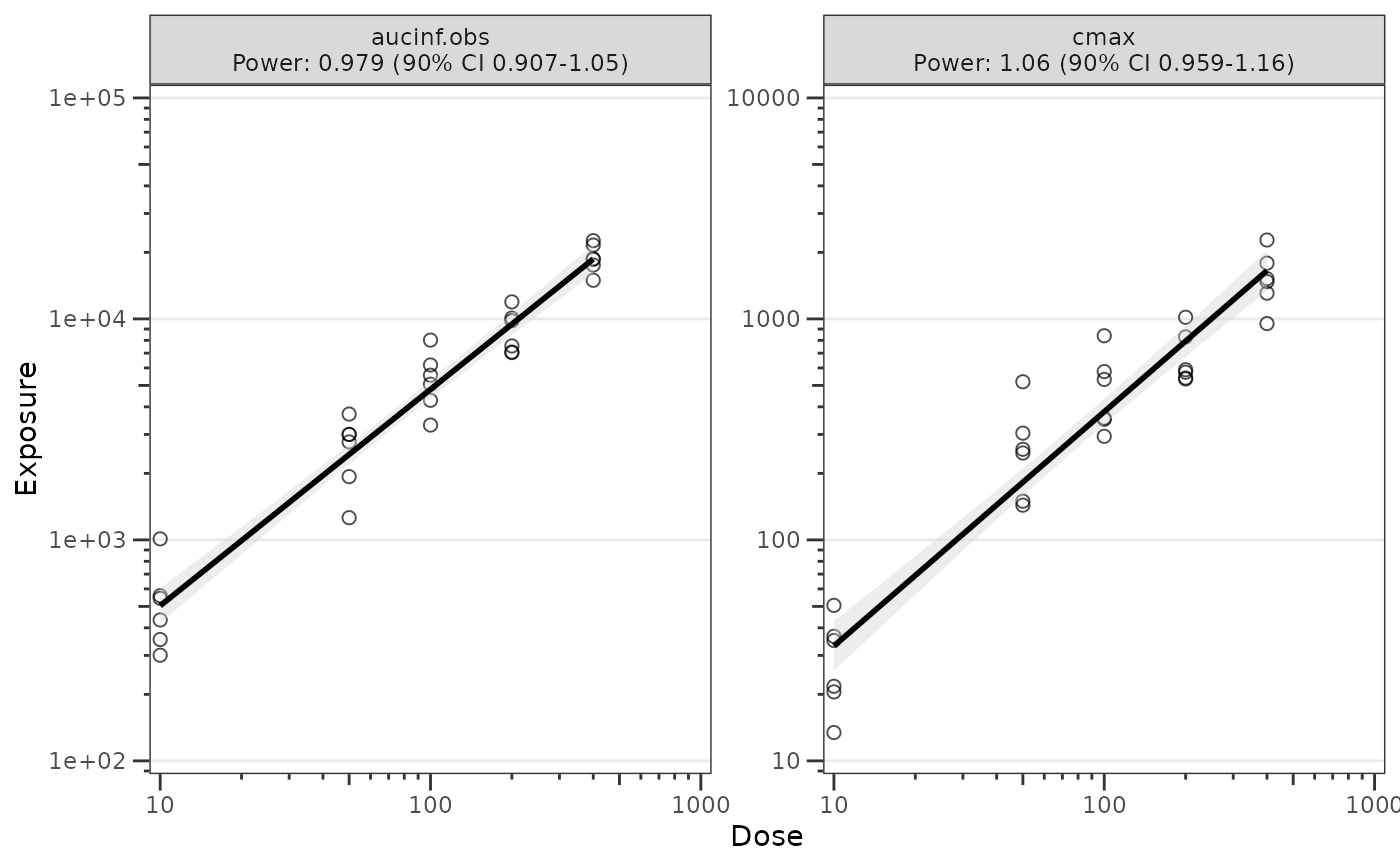 # Precomputed path: compute once, replot many times
stats <- df_doseprop(dplyr::filter(data_sad_nca, PART == "Part 1-SAD"),
metrics = c("aucinf.obs", "cmax"))
plot_doseprop(stats)
# Precomputed path: compute once, replot many times
stats <- df_doseprop(dplyr::filter(data_sad_nca, PART == "Part 1-SAD"),
metrics = c("aucinf.obs", "cmax"))
plot_doseprop(stats)
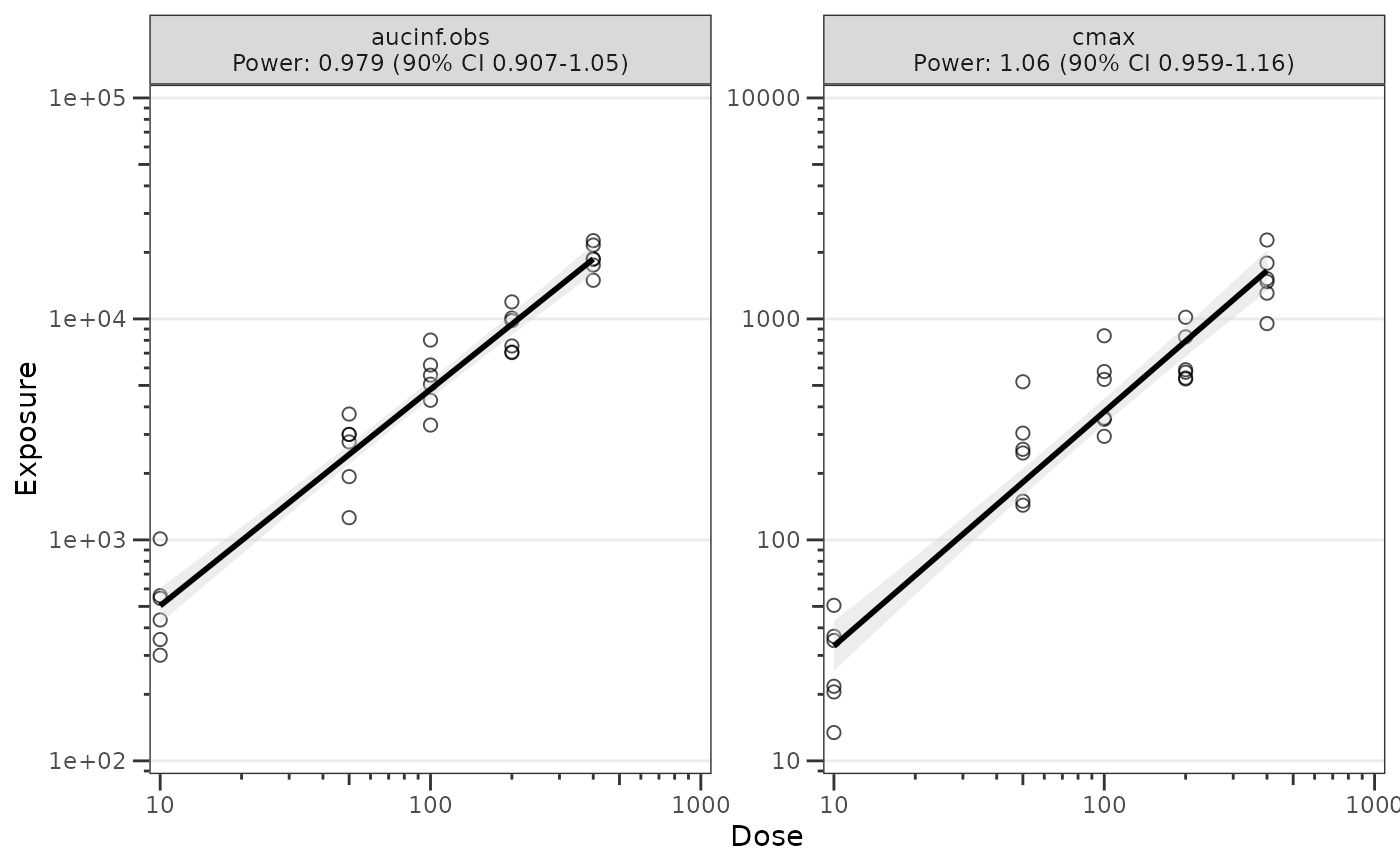 plot_doseprop(stats, se = FALSE)