ggplot2::ggplot support for Kaplan-Meier and Aalen-Johansen estimators
Source:R/ggprodlim.R
ggprodlim.Rdggplot2::ggplot support for Kaplan-Meier and Aalen-Johansen estimators
ggprodlim(x, xlim, ylim, y_breaks, x_breaks, position_atrisk, conf_int, ...)Arguments
- x
object obtained with
prodlim.- xlim
Limits for the x-axis.
- ylim
Limits for the y-axis.
- y_breaks
Breaks for the y-axis.
- x_breaks
Breaks for the x-axis.
- position_atrisk
Vector of values within xlim. Specifies where numbers at risk should be positioned on the x-axis.
- conf_int
Logical. If
TRUEpointwise confidence intervals as a shadow.- ...
passed on to
as.data.table.prodlim. Can be used to specify 'cause', 'newdata', and 'times'.
Value
A ggplot2::ggplot object
Details
Important functionality like facet_grid is not yet supported
See also
Examples
library(ggplot2)
#>
#> Attaching package: ‘ggplot2’
#> The following object is masked from ‘package:lava’:
#>
#> vars
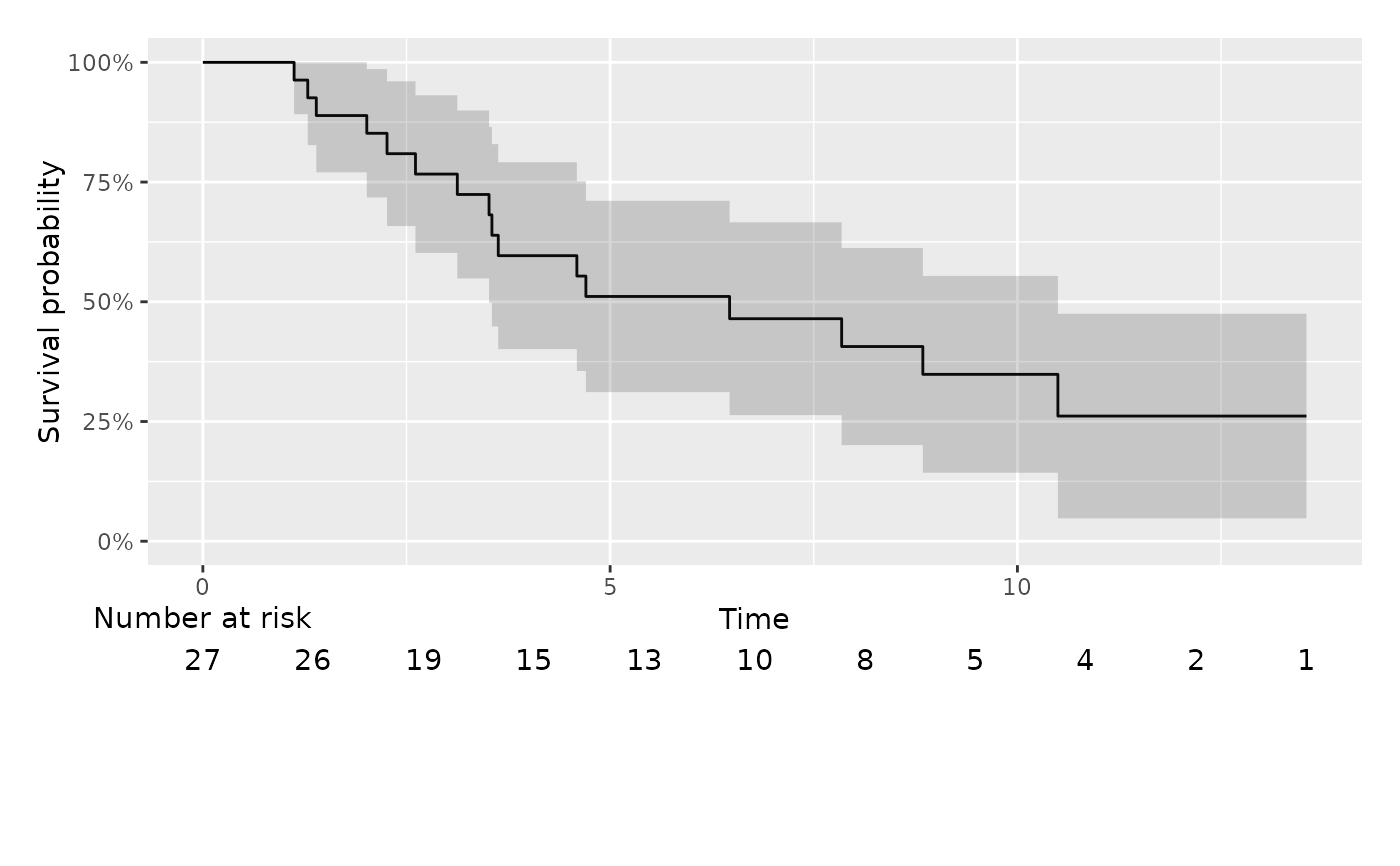
# Kaplan-Meier and stratified Kaplan-Meier
set.seed(9)
ds <- SimSurv(27)
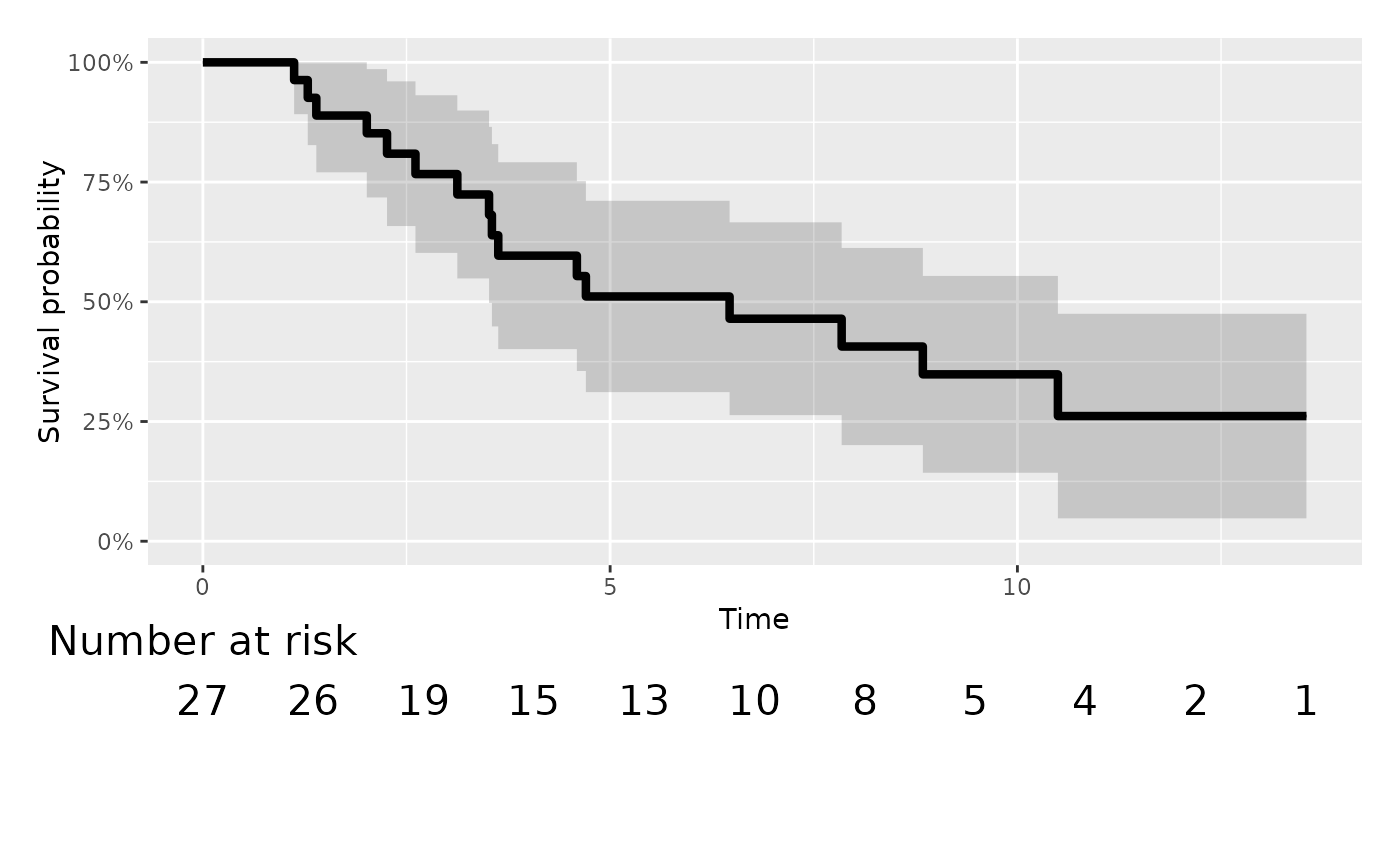
km <- prodlim(Hist(time,event)~1,data = ds)
ggprodlim(km)
#> Loading required namespace: pammtools
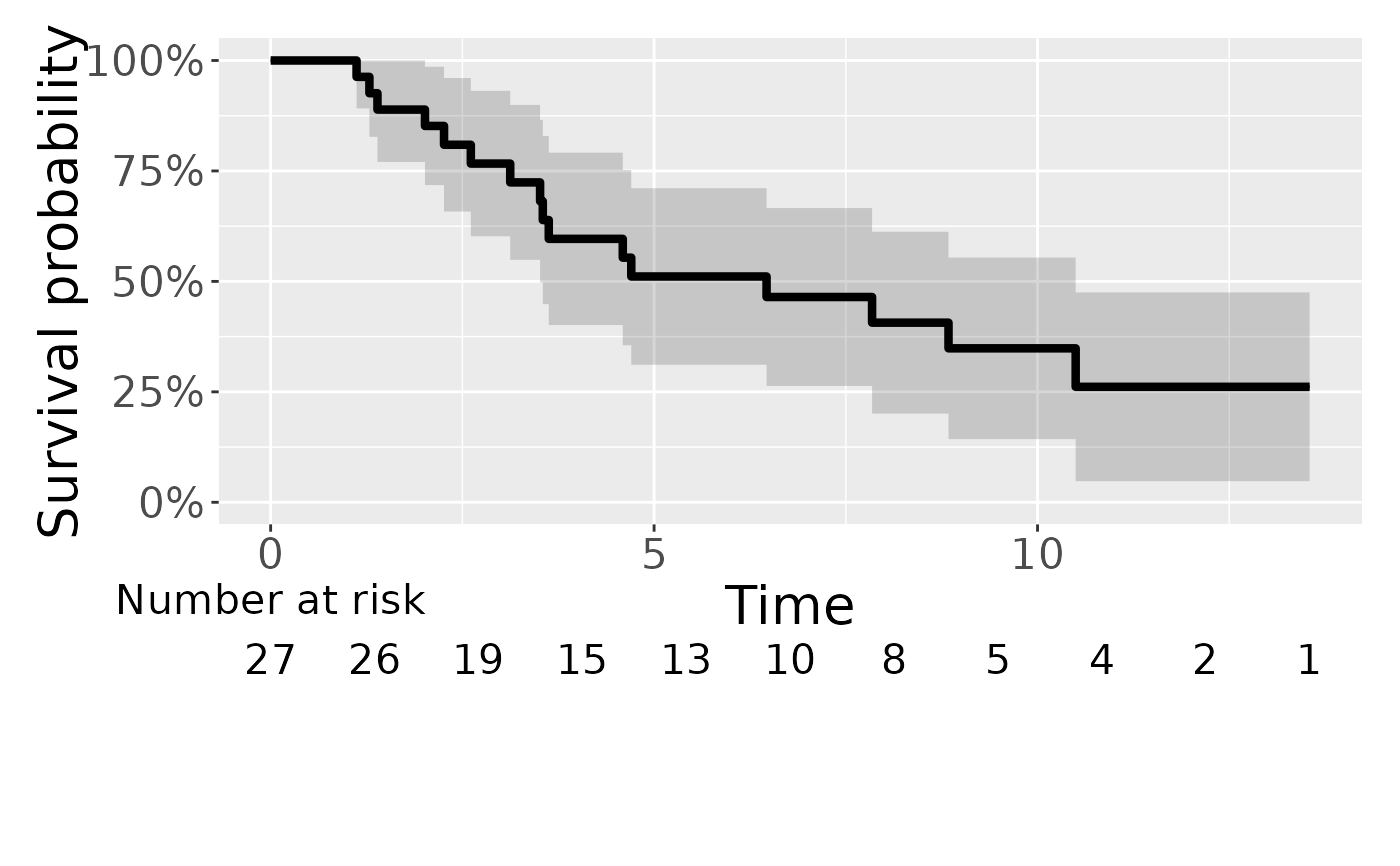
 g <- ggprodlim(km)
g <- g+geom_step(linewidth=1.5)
g + theme(text = element_text(size=20)) + update_geom_defaults("text", list(size=5.5))
g <- ggprodlim(km)
g <- g+geom_step(linewidth=1.5)
g + theme(text = element_text(size=20)) + update_geom_defaults("text", list(size=5.5))
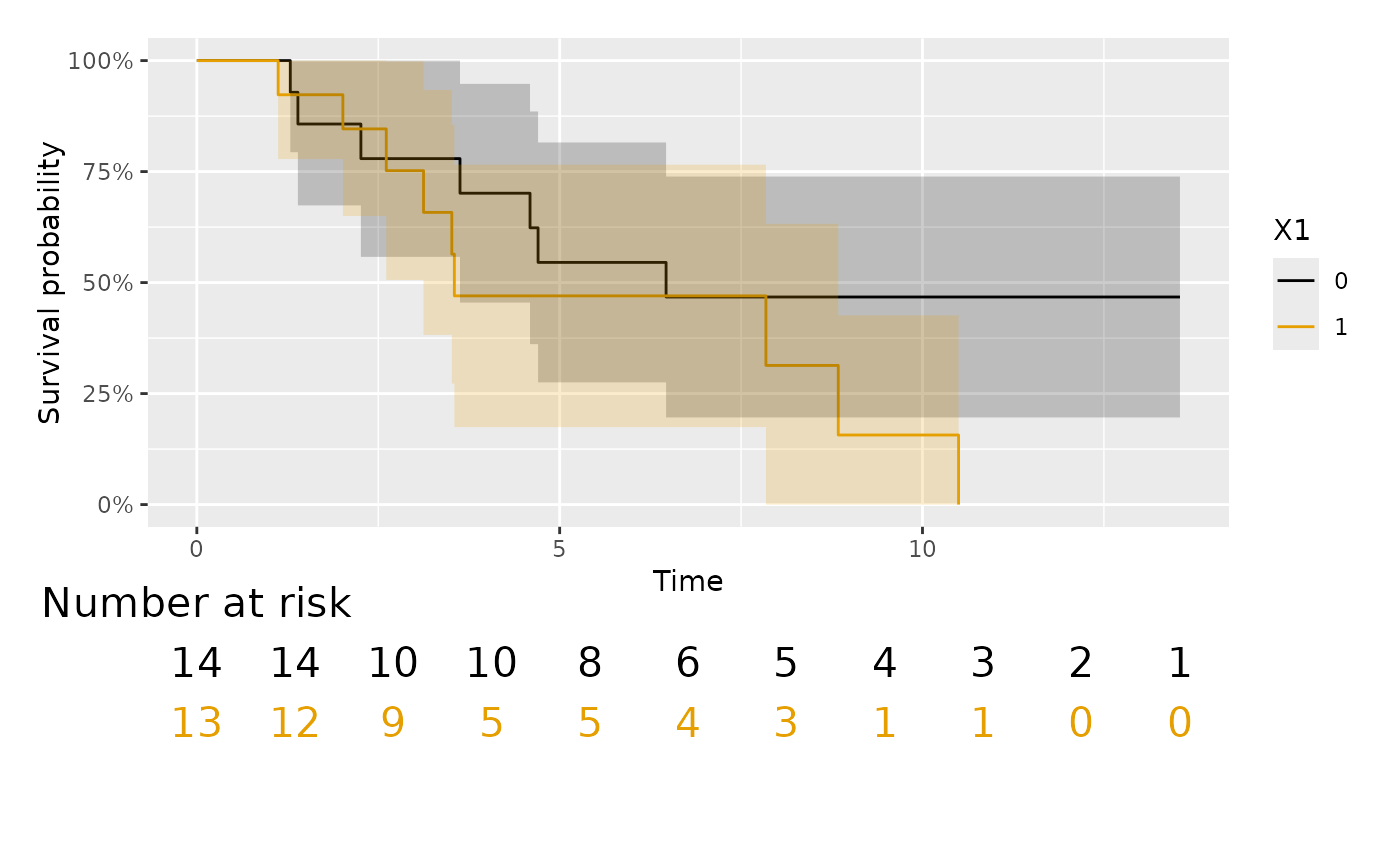
 km1 <- prodlim(Hist(time,event)~X1,data = ds)
ggprodlim(km1)
#> Warning: Removed 3 rows containing missing values or values outside the scale range
#> (`geom_step()`).
km1 <- prodlim(Hist(time,event)~X1,data = ds)
ggprodlim(km1)
#> Warning: Removed 3 rows containing missing values or values outside the scale range
#> (`geom_step()`).
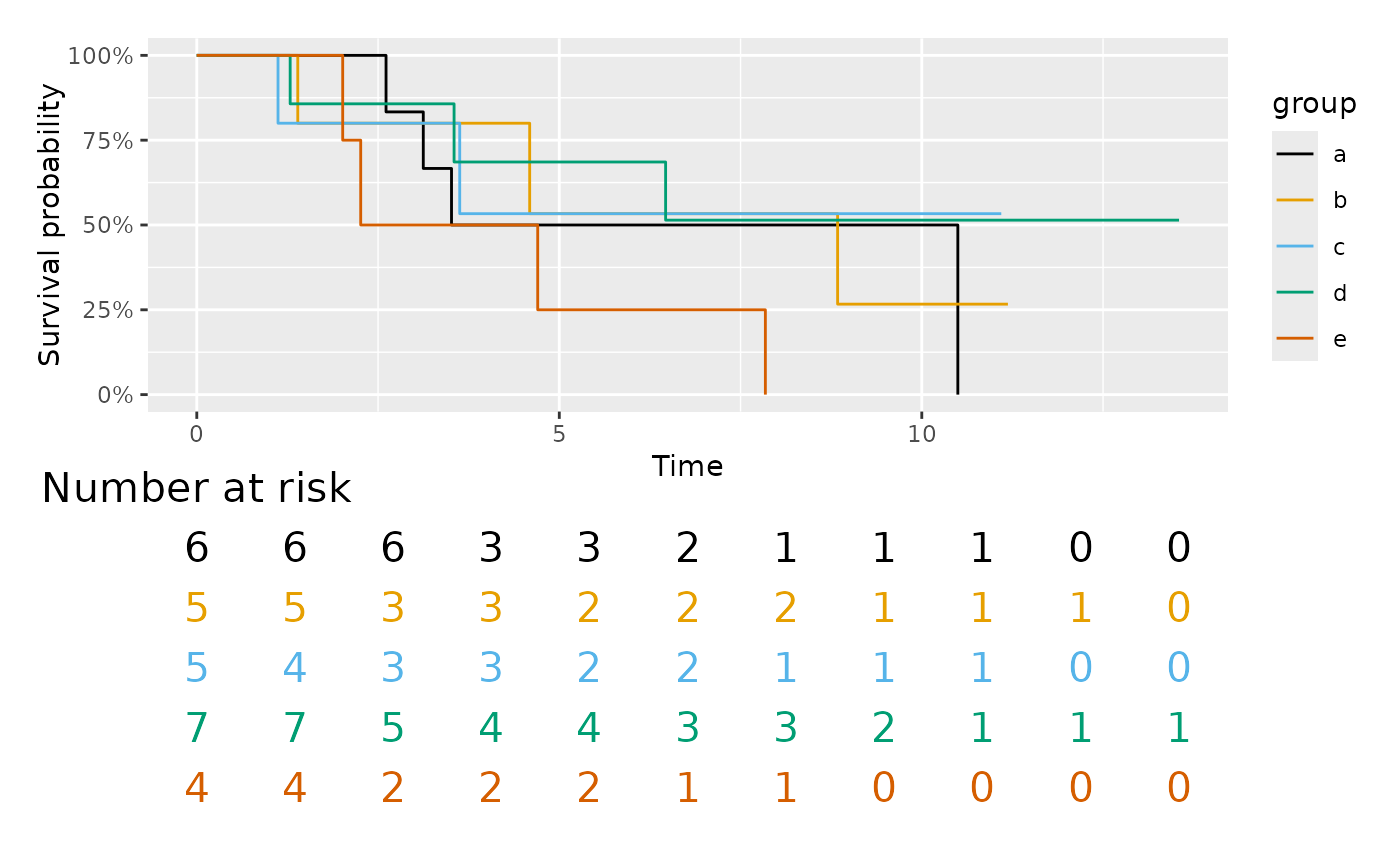
 ds$group <- factor(sample(1:5,replace=TRUE,size=27),labels=letters[1:5])
km2 <- prodlim(Hist(time,event)~group,data = ds)
ggprodlim(km2,conf_int=FALSE)
#> Warning: Removed 13 rows containing missing values or values outside the scale range
#> (`geom_step()`).
ds$group <- factor(sample(1:5,replace=TRUE,size=27),labels=letters[1:5])
km2 <- prodlim(Hist(time,event)~group,data = ds)
ggprodlim(km2,conf_int=FALSE)
#> Warning: Removed 13 rows containing missing values or values outside the scale range
#> (`geom_step()`).
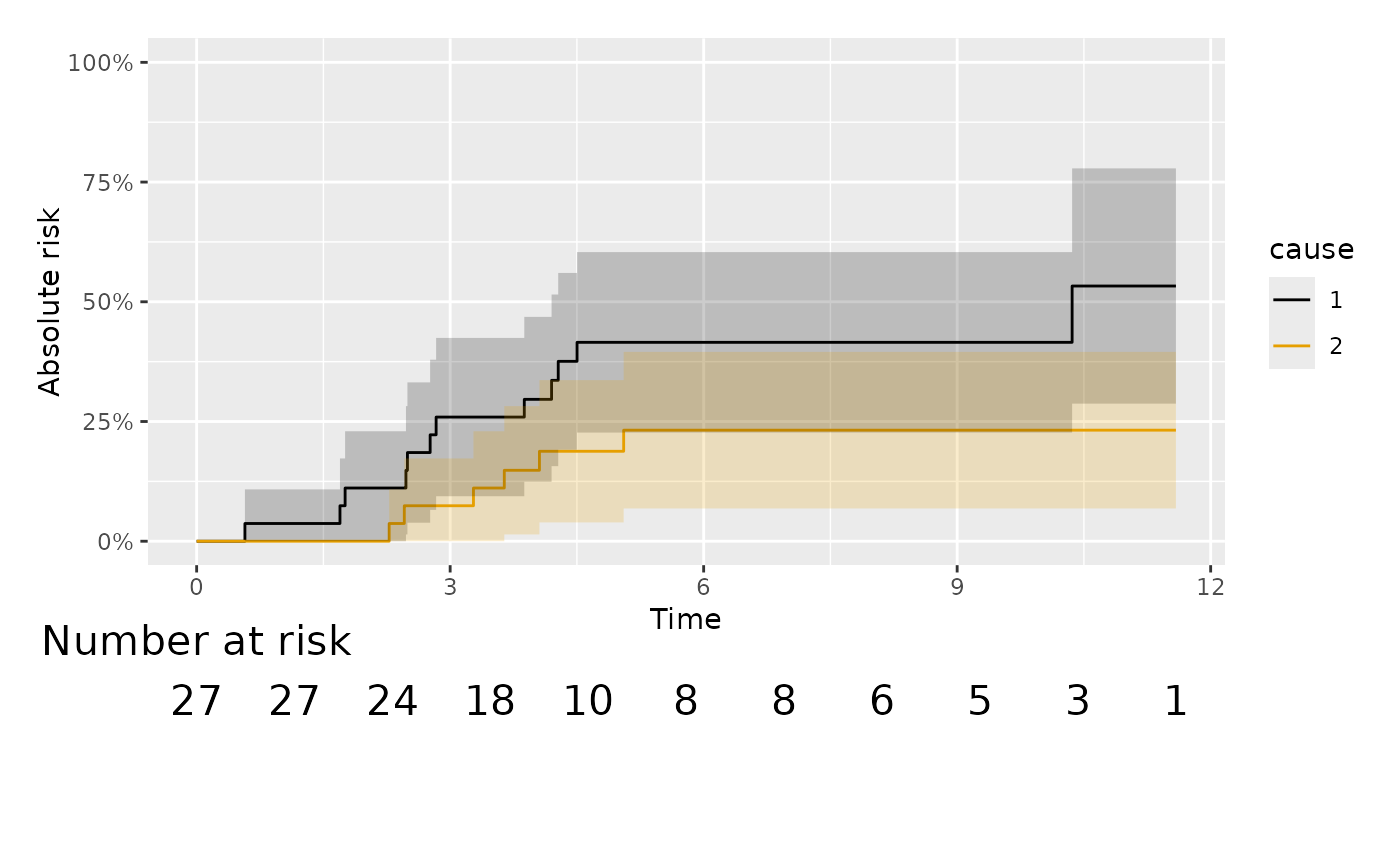
 # Aalen-Johansen and stratified Aalen-Johansen
set.seed(8)
d <- SimCompRisk(27)
d$X_group <- factor(sample(1:5,replace=TRUE,size=27),labels=letters[1:5])
aj <- prodlim(Hist(time,event)~1,data = d)
ggprodlim(aj)
# Aalen-Johansen and stratified Aalen-Johansen
set.seed(8)
d <- SimCompRisk(27)
d$X_group <- factor(sample(1:5,replace=TRUE,size=27),labels=letters[1:5])
aj <- prodlim(Hist(time,event)~1,data = d)
ggprodlim(aj)
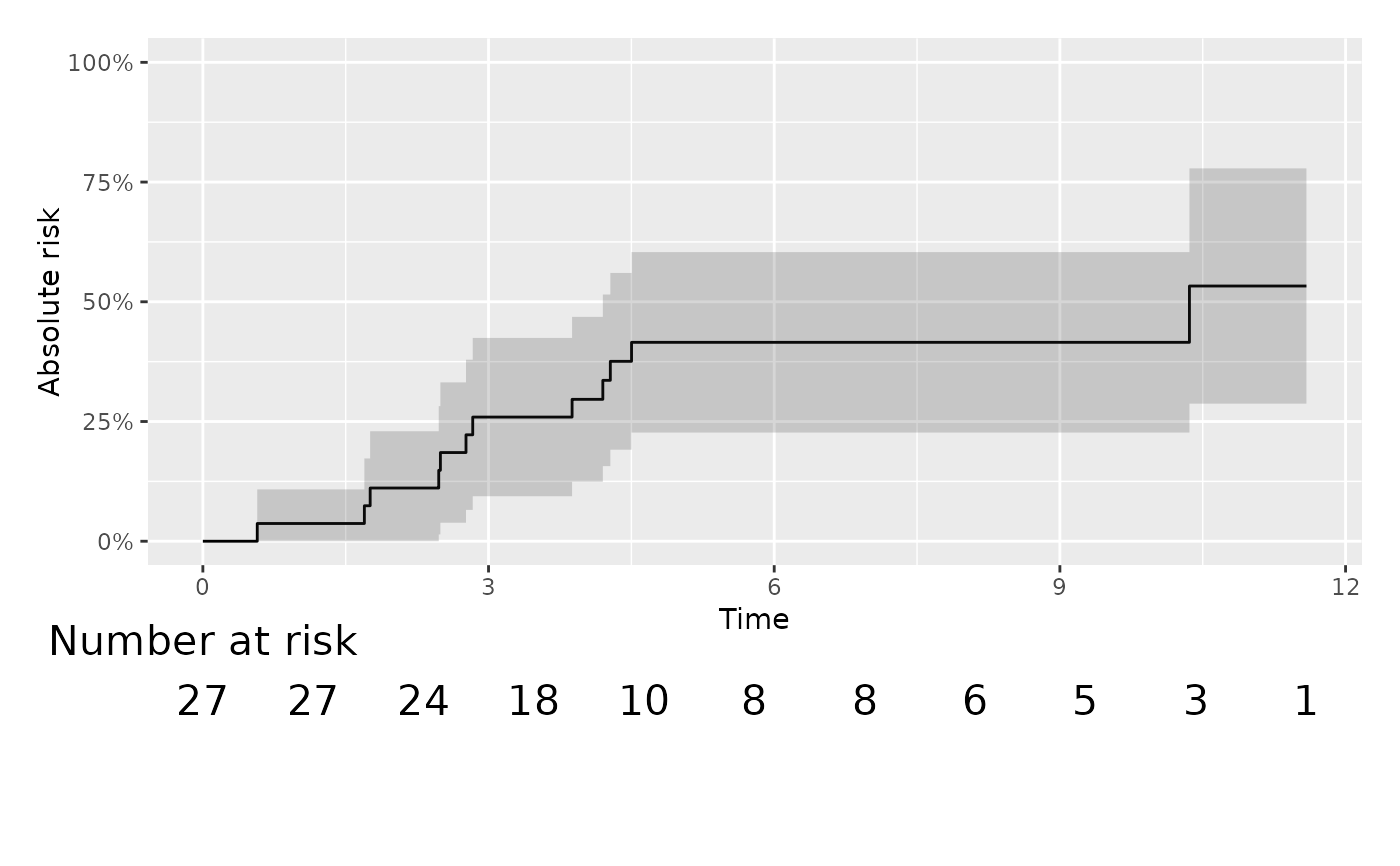
 ggprodlim(aj,cause=1)
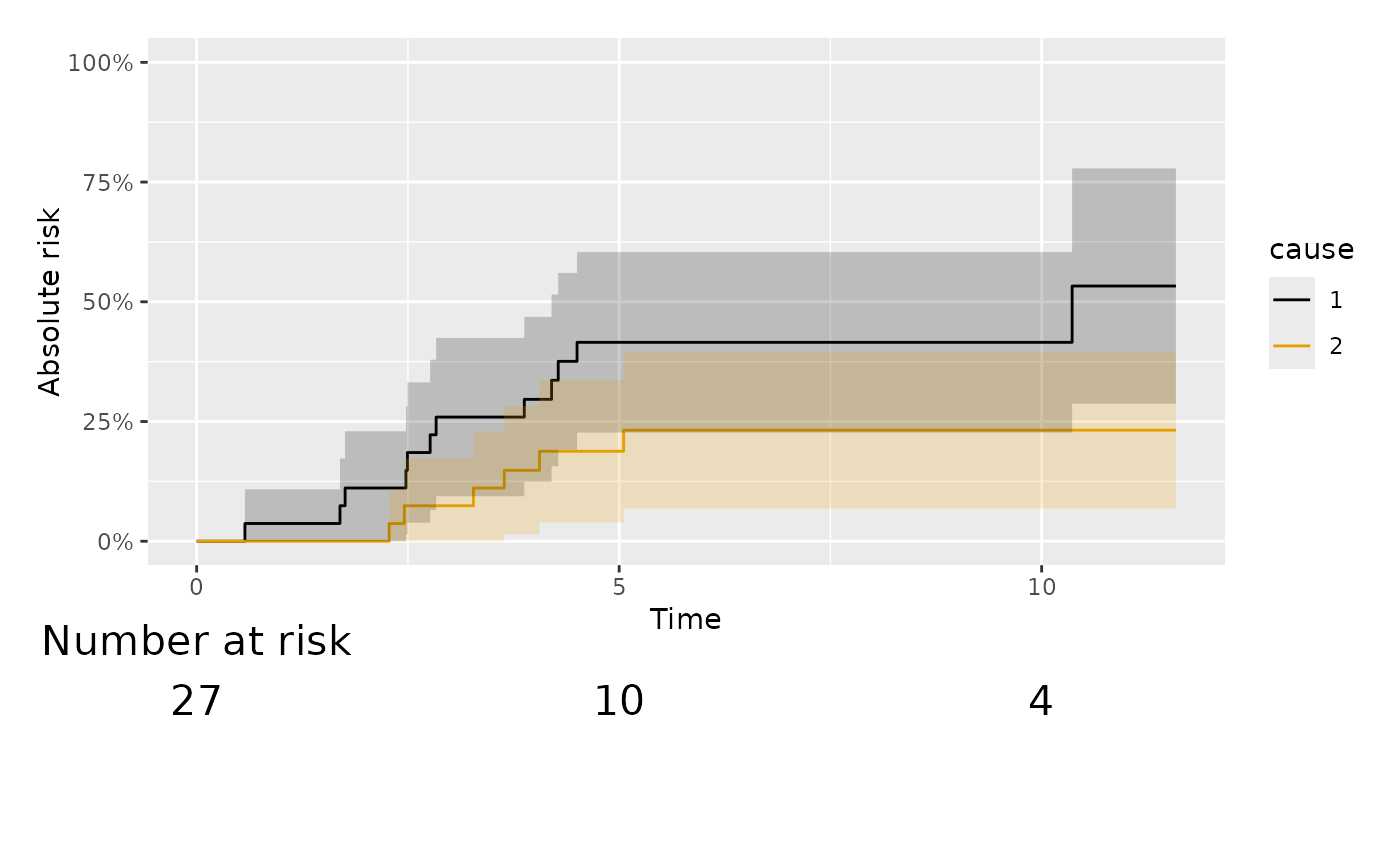
 ggprodlim(aj,position_atrisk=c(0,5,10))+scale_x_continuous(breaks=c(0,5,10))
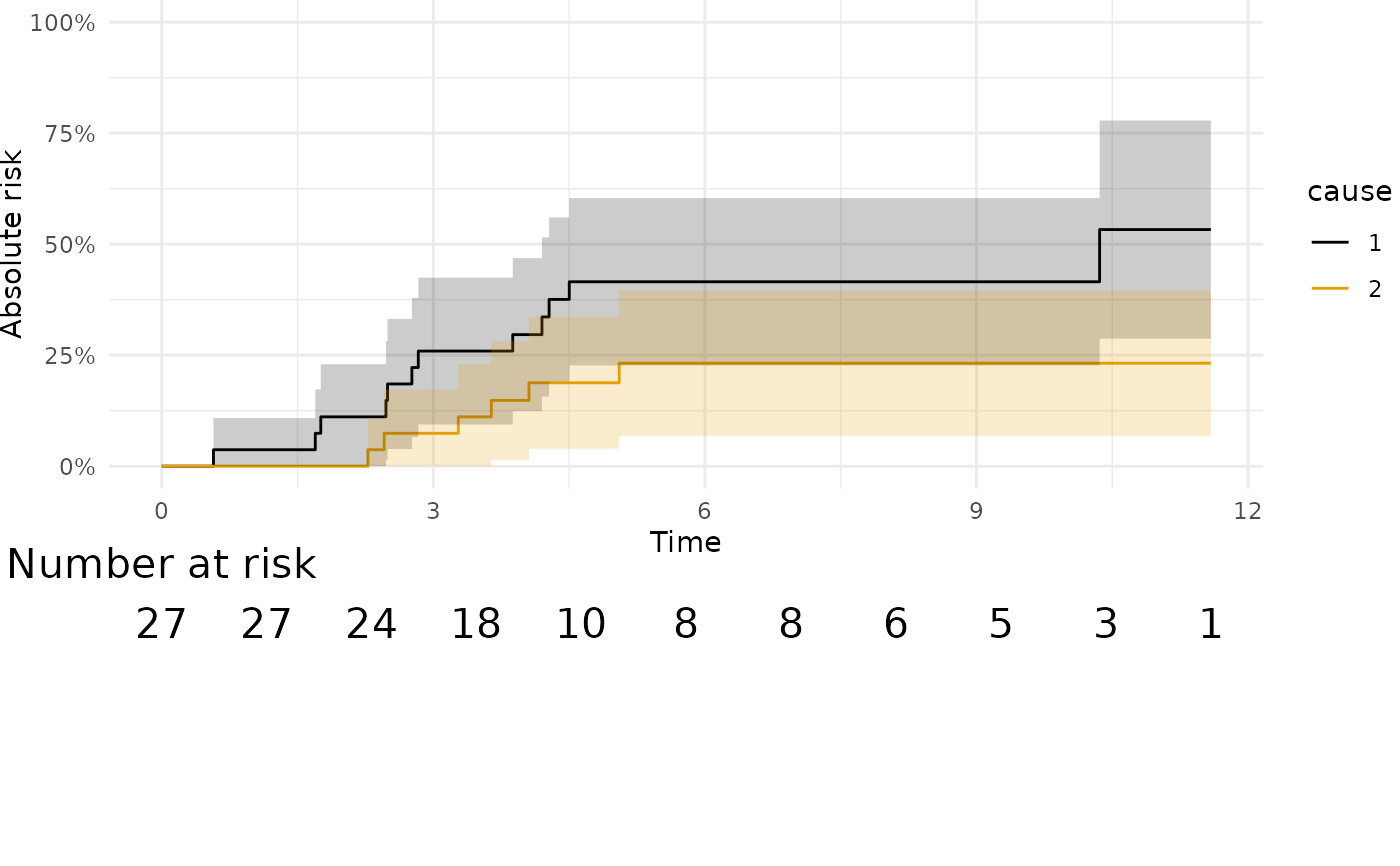
 ggprodlim(aj)+theme_minimal()+theme(plot.margin=margin(t=0,r=0,b=8,l=0,"line"))
 # changing colors
g+ggplot2::scale_fill_manual(values = 1:2)+ggplot2::scale_color_manual(values=1:2)
#> Scale for fill is already present.
#> Adding another scale for fill, which will replace the existing scale.
#> Scale for colour is already present.
#> Adding another scale for colour, which will replace the existing scale.
# changing colors
g+ggplot2::scale_fill_manual(values = 1:2)+ggplot2::scale_color_manual(values=1:2)
#> Scale for fill is already present.
#> Adding another scale for fill, which will replace the existing scale.
#> Scale for colour is already present.
#> Adding another scale for colour, which will replace the existing scale.
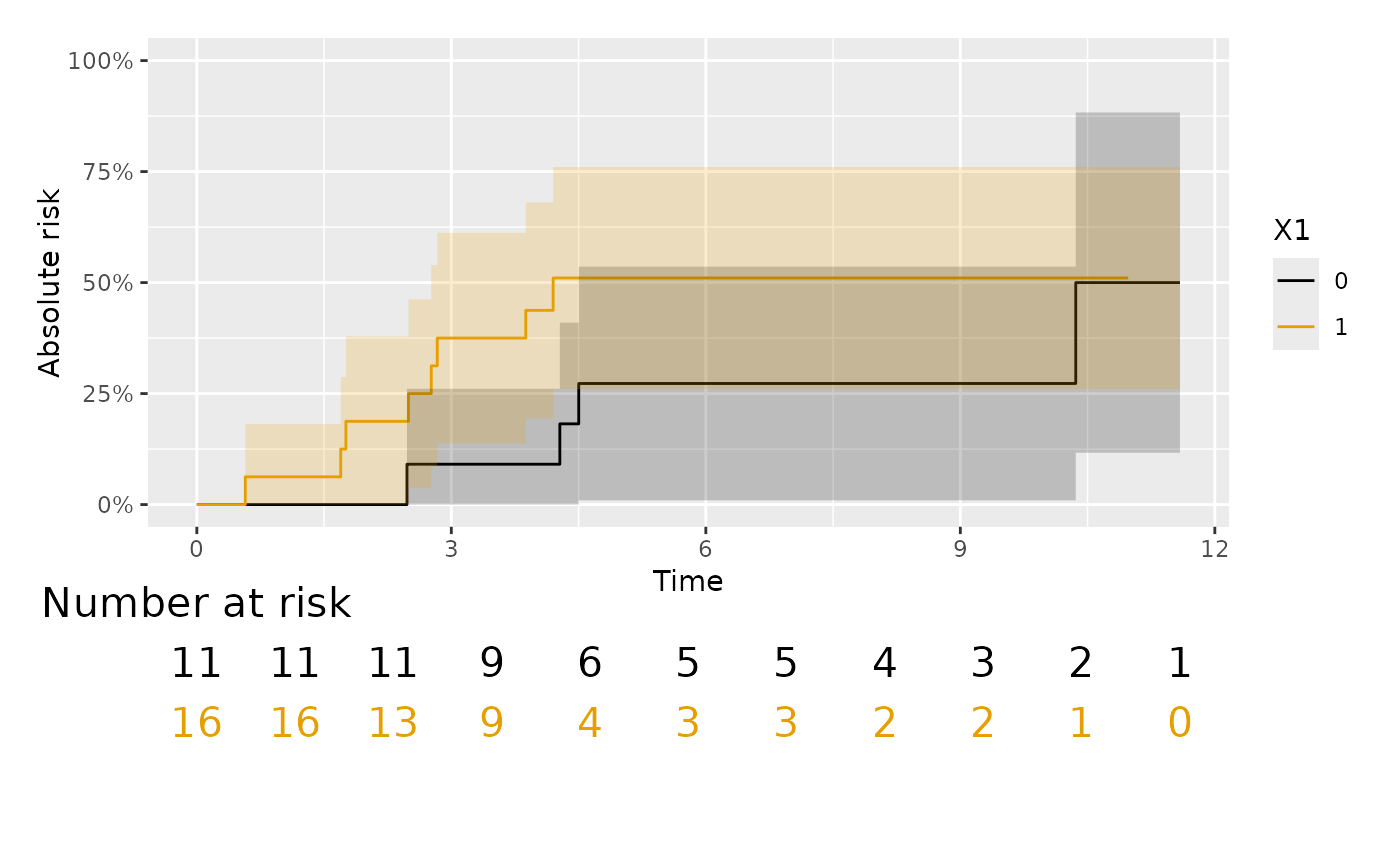
 aj <- prodlim(Hist(time,event)~X1,data = d)
ggprodlim(aj,cause = 1)
#> Warning: Removed 1 row containing missing values or values outside the scale range
#> (`geom_step()`).
aj <- prodlim(Hist(time,event)~X1,data = d)
ggprodlim(aj,cause = 1)
#> Warning: Removed 1 row containing missing values or values outside the scale range
#> (`geom_step()`).
 d$X1 <- factor(d$X1,levels=c("1","0"),labels=c("1","0"))
aj <- prodlim(Hist(time,event)~X1,data = d)
d$X1 <- factor(d$X1,levels=c("1","0"),labels=c("1","0"))
aj <- prodlim(Hist(time,event)~X1,data = d)