Draw an ICLUST hierarchical cluster structure diagram
iclust.diagram.RdGiven a cluster structure determined by ICLUST, create a graphic structural diagram using graphic functions in the psych package To create dot code to describe the ICLUST output with more precision, use ICLUST.graph. If Rgraphviz has been successfully installed, the alternative is to use ICLUST.rgraph.
Arguments
- ic
Output from ICLUST
- labels
labels for variables (if not specified as rownames in the ICLUST output
- short
if short=TRUE, variable names are replaced with Vn
- digits
Round the path coefficients to digits accuracy
- cex
The standard graphic control parameter for font size modifications. This can be used to make the labels bigger or smaller than the default values.
- min.size
Don't provide statistics for clusters less than min.size
- e.size
size of the ellipses with the cluster statistics.
- colors
postive and negative
- main
The main graphic title
- cluster.names
Normally, clusters are named sequentially C1 ... Cn. If cluster.names are specified, then these values will be used instead.
- marg
Sets the margins to be narrower than the default values. Resets them upon return
- plot
If plot is TRUE, then draw the diagram, if FALSE, then just return the veriable order from the plot
- bottomup
Which way to draw the arrows. TRUE means from the items to the clusters. See note.
- both
if TRUE report alpha and beta. if "alpha", just report the alpha, or if "beta" just report beta.
- pos
Not used
- ...
To allow parameters to be passed to lower level graphics
Details
iclust.diagram provides most of the power of ICLUST.rgraph without the difficulties involved in installing Rgraphviz. It is called automatically from ICLUST.
Following a request by Michael Kubovy, cluster.names may be specified to replace the normal C1 ... Cn names.
If access to a dot language graphics program is available, it is probably better to use the iclust.graph function to get dot output for offline editing.
Until 3/11/23 arrows went from clusters to items. The default value for bottomup has been changed to draw from items to clusters. To draw the old way, set bottomup=TRUE.
Value
Graphical output summarizing the hierarchical cluster structure. The graph is drawn using the diagram functions (e.g., dia.curve, dia.arrow, dia.rect, dia.ellipse ) created as a work around to Rgraphviz.
Also returned (invisibly) is a vector of variable names ordered by their location in the tree diagram. The plot option suppresses the plot for speed.
References
Revelle, W. Hierarchical Cluster Analysis and the Internal Structure of Tests. Multivariate Behavioral Research, 1979, 14, 57-74.
Note
Suggestions for improving the graphic output are welcome. Thus, the request from Steven Reise to just display alpha and not beta was added in June, 2024.
See also
Examples
v9 <- sim.hierarchical()
v9c <- ICLUST(v9)
 test.data <- Harman74.cor$cov
ic.out <- ICLUST(test.data)
test.data <- Harman74.cor$cov
ic.out <- ICLUST(test.data)
 #now show how to relabel clusters
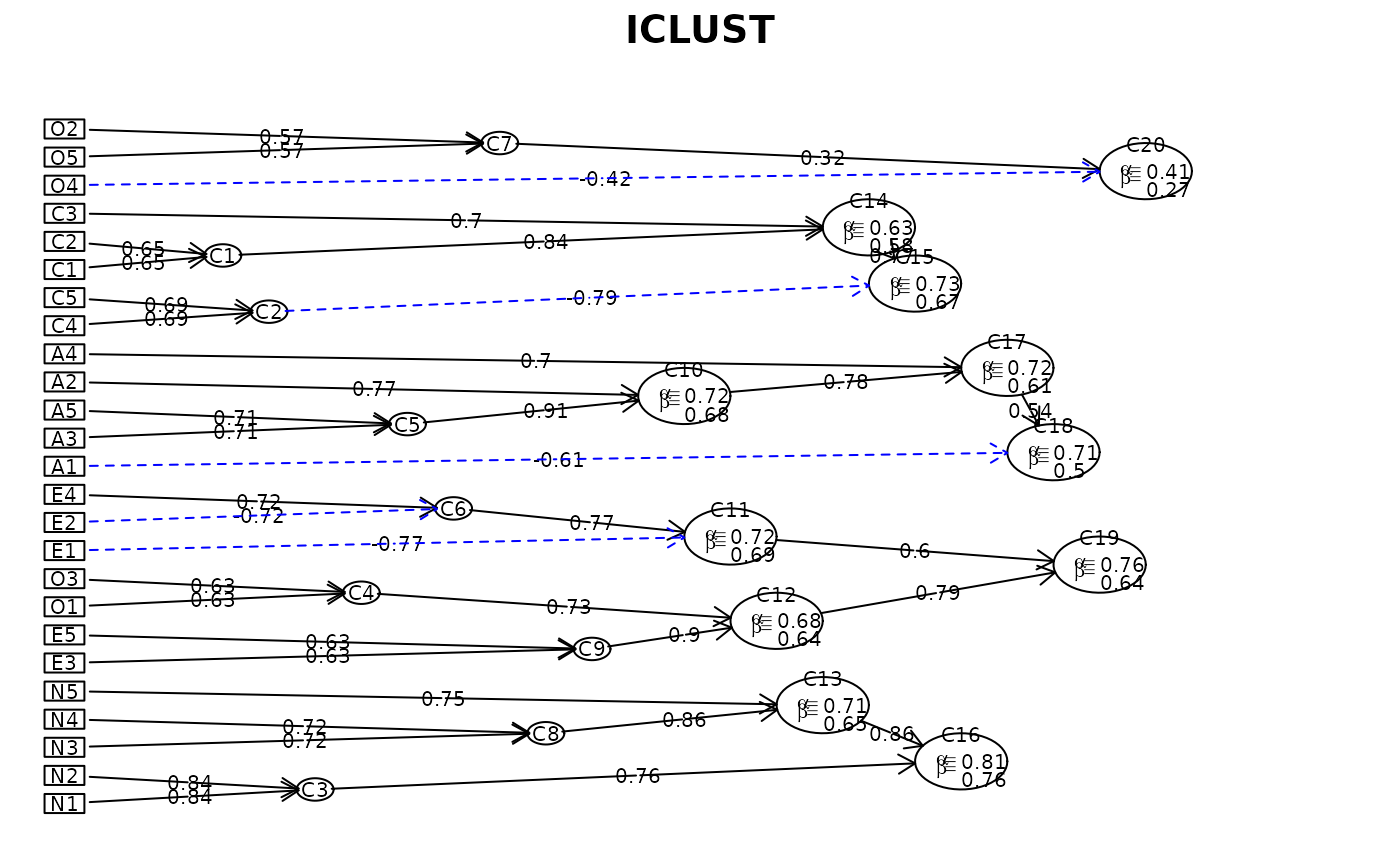
ic.bfi <- iclust(bfi[1:25],beta=3) #find the clusters
#now show how to relabel clusters
ic.bfi <- iclust(bfi[1:25],beta=3) #find the clusters
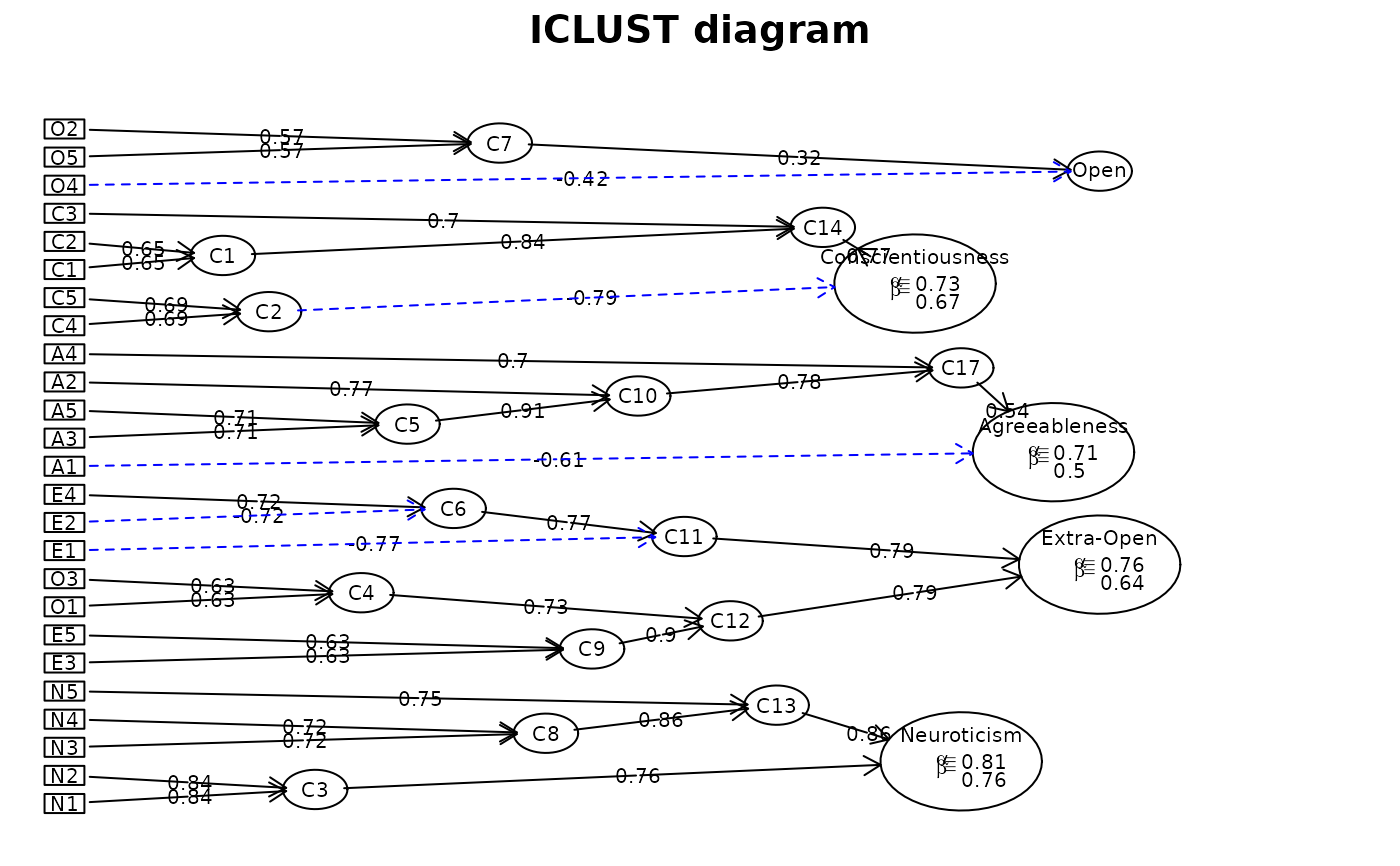
 cluster.names <- rownames(ic.bfi$results) #get the old names
#change the names to the desired ones
cluster.names[c(16,19,18,15,20)] <- c("Neuroticism","Extra-Open","Agreeableness",
"Conscientiousness","Open")
#now show the new names
iclust.diagram(ic.bfi,cluster.names=cluster.names,min.size=4,e.size=1.75)
cluster.names <- rownames(ic.bfi$results) #get the old names
#change the names to the desired ones
cluster.names[c(16,19,18,15,20)] <- c("Neuroticism","Extra-Open","Agreeableness",
"Conscientiousness","Open")
#now show the new names
iclust.diagram(ic.bfi,cluster.names=cluster.names,min.size=4,e.size=1.75)