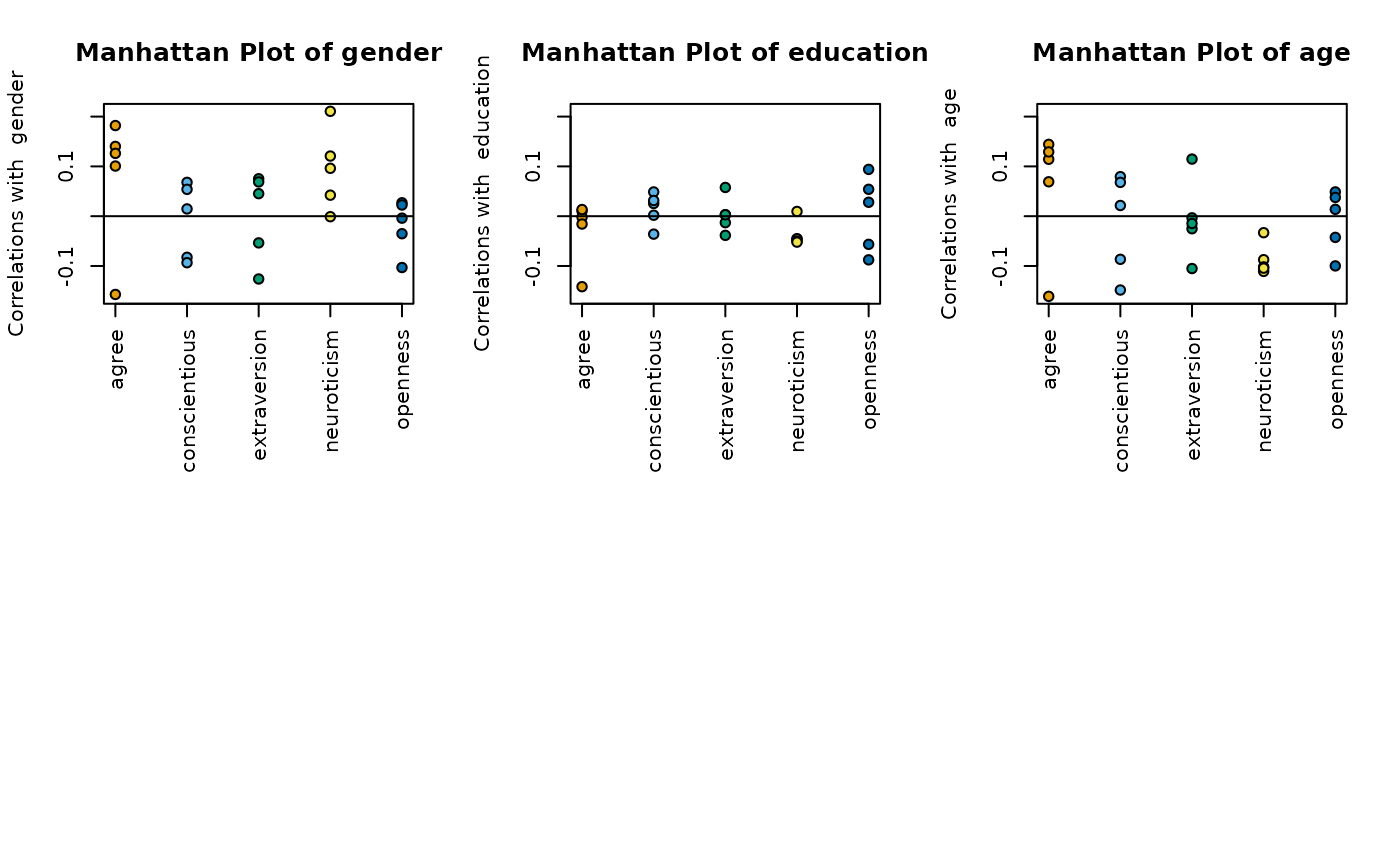
"Manhattan" plots of correlations with a set of criteria.
manhattan.RdA useful way of showing the strength of many correlations with a particular criterion is the Manhattan plot. This is just a plot of correlations ordered by some keying variable. Useful to understand the basis of items used in bestScales.
manhattan(x, criteria = NULL, keys = NULL,raw=TRUE,n.obs=NULL, abs = TRUE,
  ylab = NULL, labels = NULL, log.p = FALSE,ci=.05, pch = 21,
 main = "Manhattan Plot of", adjust="holm",ylim = NULL,digits=2,dictionary=NULL, ...)
Arguments
- x
A matrix or data.frame of items or a correlation matrix.
- criteria
What column names should be predicted. If a separate file, what are the variables to predict.
- keys
a keys.list similar to that used in
scoreItems- raw
The default is raw data, the alternative is a correlation matrix
- n.obs
If given a correlation matrix, and showing log.p, we need the number of observations
- abs
Should we show the absolute value of the correlations.
- ylab
If NULL, will label as either correlations or log (10) of correlations
- labels
if NULL, will use the names of the keys
- log.p
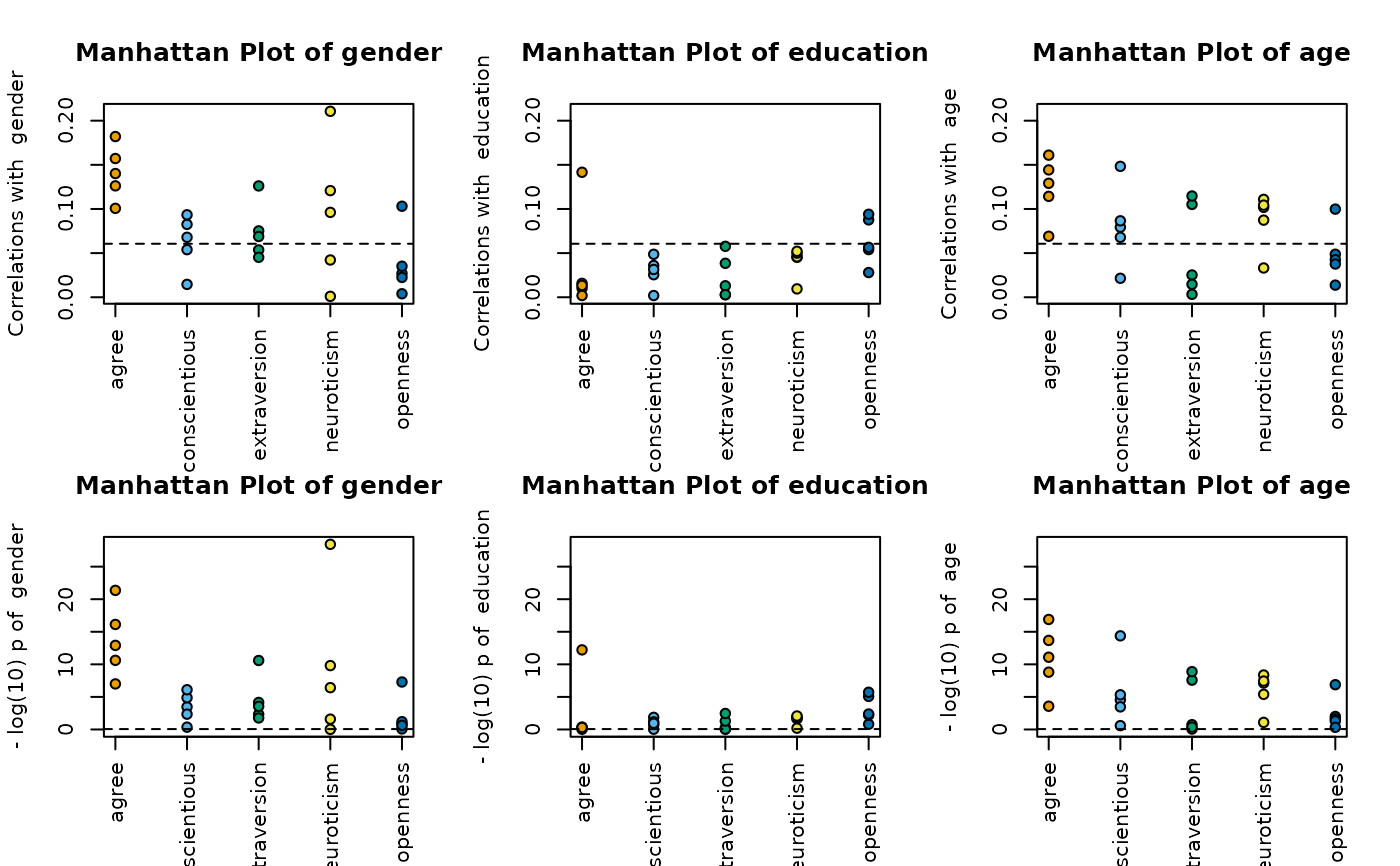
Should we show the correlations (log.p = FALSE) or the log of the probabilities of the correlations (TRUE)
- ci
The probability for the upper and lower confidence intervals – bonferroni adjusted
- pch
The default plot chararcter is a filled circle
- main
The title for each criterion
- adjust
Which adjustment for multiple correlations should be applied ("holm", "bonferroni", "none")
- ylim
If NULL will be the min and max of the data
- digits
Round off the results to digits
- dictionary
A dictionary of items
- ...
Other graphic parameters
Details
When exploring the correlations of many items with a few criteria, it is useful to form scales from the most correlated items (see bestScales. To get a feeling of the distribution of items across various measures, we can display their correlations (or the log of the probabilities) grouped by some set of scale keys. May also be used to display and order correlations (rows) with a criteria (columns) if given a correlation as input (raw=FALSE).
Value
The correlations or the log p values are returned (invisibily)
See also
Examples
op <- par(mfrow=(c(2,3))) #we want to compare two different sets of plots
manhattan(bfi[1:25],bfi[26:28]
,labels=colnames(bfi)[1:25], dictionary=bfi.dictionary)
manhattan(bfi[1:25],bfi[26:28],log.p=TRUE,
dictionary=bfi.dictionary)
 #Do it again, but now show items by the keys.list
bfi.keys <-
list(agree=c("-A1","A2","A3","A4","A5"),conscientious=c("C1","C2","C3","-C4","-C5"),
extraversion=c("-E1","-E2","E3","E4","E5"),neuroticism=c("N1","N2","N3","N4","N5"),
openness = c("O1","-O2","O3","O4","-O5"))
man <- manhattan(bfi[1:25],bfi[26:28],keys=bfi.keys,
dictionary=bfi.dictionary[1:2])
manhattan(bfi[1:25],bfi[26:28],keys=bfi.keys,log.p=TRUE,
dictionary=bfi.dictionary[1:2])
#Do it again, but now show items by the keys.list
bfi.keys <-
list(agree=c("-A1","A2","A3","A4","A5"),conscientious=c("C1","C2","C3","-C4","-C5"),
extraversion=c("-E1","-E2","E3","E4","E5"),neuroticism=c("N1","N2","N3","N4","N5"),
openness = c("O1","-O2","O3","O4","-O5"))
man <- manhattan(bfi[1:25],bfi[26:28],keys=bfi.keys,
dictionary=bfi.dictionary[1:2])
manhattan(bfi[1:25],bfi[26:28],keys=bfi.keys,log.p=TRUE,
dictionary=bfi.dictionary[1:2])
 #Alternatively, use a matrix as input
R <-cor(bfi[1:25],bfi[26:28],use="pairwise")
manhattan(R,cs(gender,education,age),keys=bfi.keys,
dictionary=bfi.dictionary[1:2], raw=FALSE,abs=FALSE)
par <- op
psych:::dfOrder(man,1,ascending=FALSE) #print out the items sorted on gender
#> gender education age ItemLabel Item
#> N5 0.21 0.05 0.10 q_1505 Panic easily.
#> A2 0.18 0.01 0.11 q_1162 Inquire about others' well-being.
#> A1 0.16 0.14 0.16 q_146 Am indifferent to the feelings of others.
#> A3 0.14 0.00 0.07 q_1206 Know how to comfort others.
#> A4 0.13 0.02 0.14 q_1364 Love children.
#> E1 0.13 0.00 0.03 q_712 Don't talk a lot.
#> N3 0.12 0.05 0.11 q_1099 Have frequent mood swings.
#> A5 0.10 0.01 0.13 q_1419 Make people feel at ease.
#> N2 0.10 0.05 0.10 q_974 Get irritated easily.
#> O1 0.10 0.03 0.05 q_128 Am full of ideas.
#> C5 0.09 0.03 0.09 q_1949 Waste my time.
#> C4 0.08 0.04 0.15 q_626 Do things in a half-way manner.
#> E4 0.08 0.04 0.01 q_1410 Make friends easily.
#> C2 0.07 0.00 0.02 q_530 Continue until everything is perfect.
#> E5 0.07 0.06 0.11 q_1768 Take charge.
#> C3 0.05 0.05 0.07 q_619 Do things according to a plan.
#> E2 0.05 0.01 0.11 q_901 Find it difficult to approach others.
#> E3 0.05 0.00 0.00 q_1205 Know how to captivate people.
#> N1 0.04 0.05 0.09 q_952 Get angry easily.
#> O3 0.04 0.09 0.04 q_492 Carry the conversation to a higher level.
#> O2 0.03 0.09 0.04 q_316 Avoid difficult reading material.
#> O5 0.02 0.06 0.10 q_1964 Will not probe deeply into a subject.
#> C1 0.01 0.03 0.08 q_124 Am exacting in my work.
#> N4 0.00 0.01 0.03 q_1479 Often feel blue.
#> O4 0.00 0.05 0.01 q_1738 Spend time reflecting on things.
#Alternatively, use a matrix as input
R <-cor(bfi[1:25],bfi[26:28],use="pairwise")
manhattan(R,cs(gender,education,age),keys=bfi.keys,
dictionary=bfi.dictionary[1:2], raw=FALSE,abs=FALSE)
par <- op
psych:::dfOrder(man,1,ascending=FALSE) #print out the items sorted on gender
#> gender education age ItemLabel Item
#> N5 0.21 0.05 0.10 q_1505 Panic easily.
#> A2 0.18 0.01 0.11 q_1162 Inquire about others' well-being.
#> A1 0.16 0.14 0.16 q_146 Am indifferent to the feelings of others.
#> A3 0.14 0.00 0.07 q_1206 Know how to comfort others.
#> A4 0.13 0.02 0.14 q_1364 Love children.
#> E1 0.13 0.00 0.03 q_712 Don't talk a lot.
#> N3 0.12 0.05 0.11 q_1099 Have frequent mood swings.
#> A5 0.10 0.01 0.13 q_1419 Make people feel at ease.
#> N2 0.10 0.05 0.10 q_974 Get irritated easily.
#> O1 0.10 0.03 0.05 q_128 Am full of ideas.
#> C5 0.09 0.03 0.09 q_1949 Waste my time.
#> C4 0.08 0.04 0.15 q_626 Do things in a half-way manner.
#> E4 0.08 0.04 0.01 q_1410 Make friends easily.
#> C2 0.07 0.00 0.02 q_530 Continue until everything is perfect.
#> E5 0.07 0.06 0.11 q_1768 Take charge.
#> C3 0.05 0.05 0.07 q_619 Do things according to a plan.
#> E2 0.05 0.01 0.11 q_901 Find it difficult to approach others.
#> E3 0.05 0.00 0.00 q_1205 Know how to captivate people.
#> N1 0.04 0.05 0.09 q_952 Get angry easily.
#> O3 0.04 0.09 0.04 q_492 Carry the conversation to a higher level.
#> O2 0.03 0.09 0.04 q_316 Avoid difficult reading material.
#> O5 0.02 0.06 0.10 q_1964 Will not probe deeply into a subject.
#> C1 0.01 0.03 0.08 q_124 Am exacting in my work.
#> N4 0.00 0.01 0.03 q_1479 Often feel blue.
#> O4 0.00 0.05 0.01 q_1738 Spend time reflecting on things.