Find and graph Mahalanobis squared distances to detect outliers
outlier.RdThe Mahalanobis distance is \(D^2 = (x-\mu)' \Sigma^-1 (x-\mu)\) where \(\Sigma\) is the covariance of the x matrix. D2 may be used as a way of detecting outliers in distribution. Large D2 values, compared to the expected Chi Square values indicate an unusual response pattern. The mahalanobis function in stats does not handle missing data.
outlier(x, plot = TRUE, bad = 5,na.rm = TRUE, xlab, ylab, ...)Arguments
Details
Adapted from the mahalanobis function and help page from stats.
Value
The D2 values for each case
References
Yuan, Ke-Hai and Zhong, Xiaoling, (2008) Outliers, Leverage Observations, and Influential Cases in Factor Analysis: Using Robust Procedures to Minimize Their Effect, Sociological Methodology, 38, 329-368.
See also
Examples
#first, just find and graph the outliers
d2 <- outlier(sat.act)
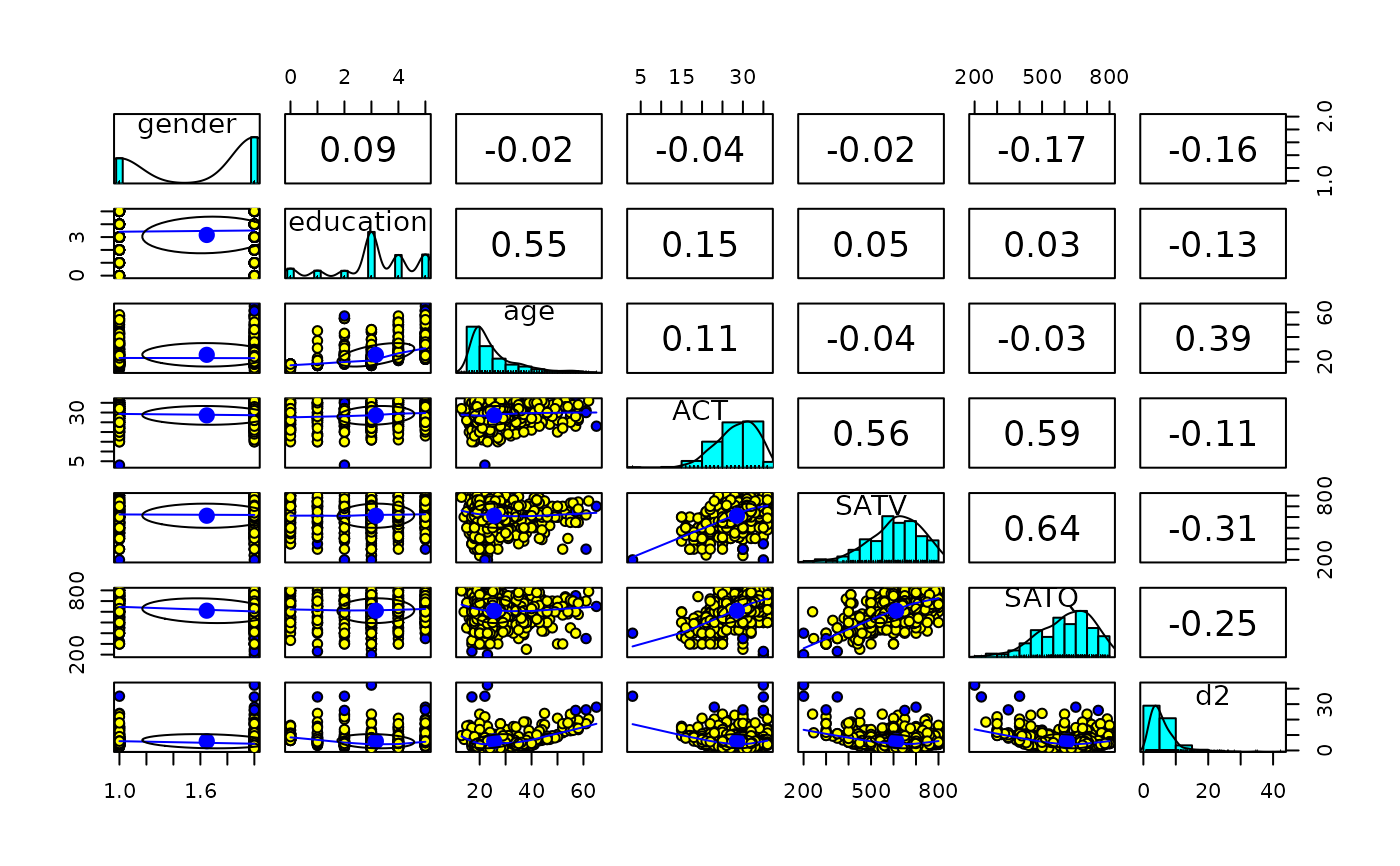
 #combine with the data frame and plot it with the outliers highlighted in blue
sat.d2 <- data.frame(sat.act,d2)
pairs.panels(sat.d2,bg=c("yellow","blue")[(d2 > 25)+1],pch=21)
#combine with the data frame and plot it with the outliers highlighted in blue
sat.d2 <- data.frame(sat.act,d2)
pairs.panels(sat.d2,bg=c("yellow","blue")[(d2 > 25)+1],pch=21)