Multi-dimensional Scaling Plot of Proximity matrix from randomForest
MDSplot.RdPlot the scaling coordinates of the proximity matrix from randomForest.
MDSplot(rf, fac, k=2, palette=NULL, pch=20, ...)Arguments
- rf
an object of class
randomForestthat contains theproximitycomponent.- fac
a factor that was used as response to train
rf.- k
number of dimensions for the scaling coordinates.
- palette
colors to use to distinguish the classes; length must be the equal to the number of levels.
- pch
plotting symbols to use.
- ...
other graphical parameters.
Value
The output of cmdscale on 1 - rf$proximity is
returned invisibly.
Note
If k > 2, pairs is used to produce the
scatterplot matrix of the coordinates.
See also
Examples
set.seed(1)
data(iris)
iris.rf <- randomForest(Species ~ ., iris, proximity=TRUE,
keep.forest=FALSE)
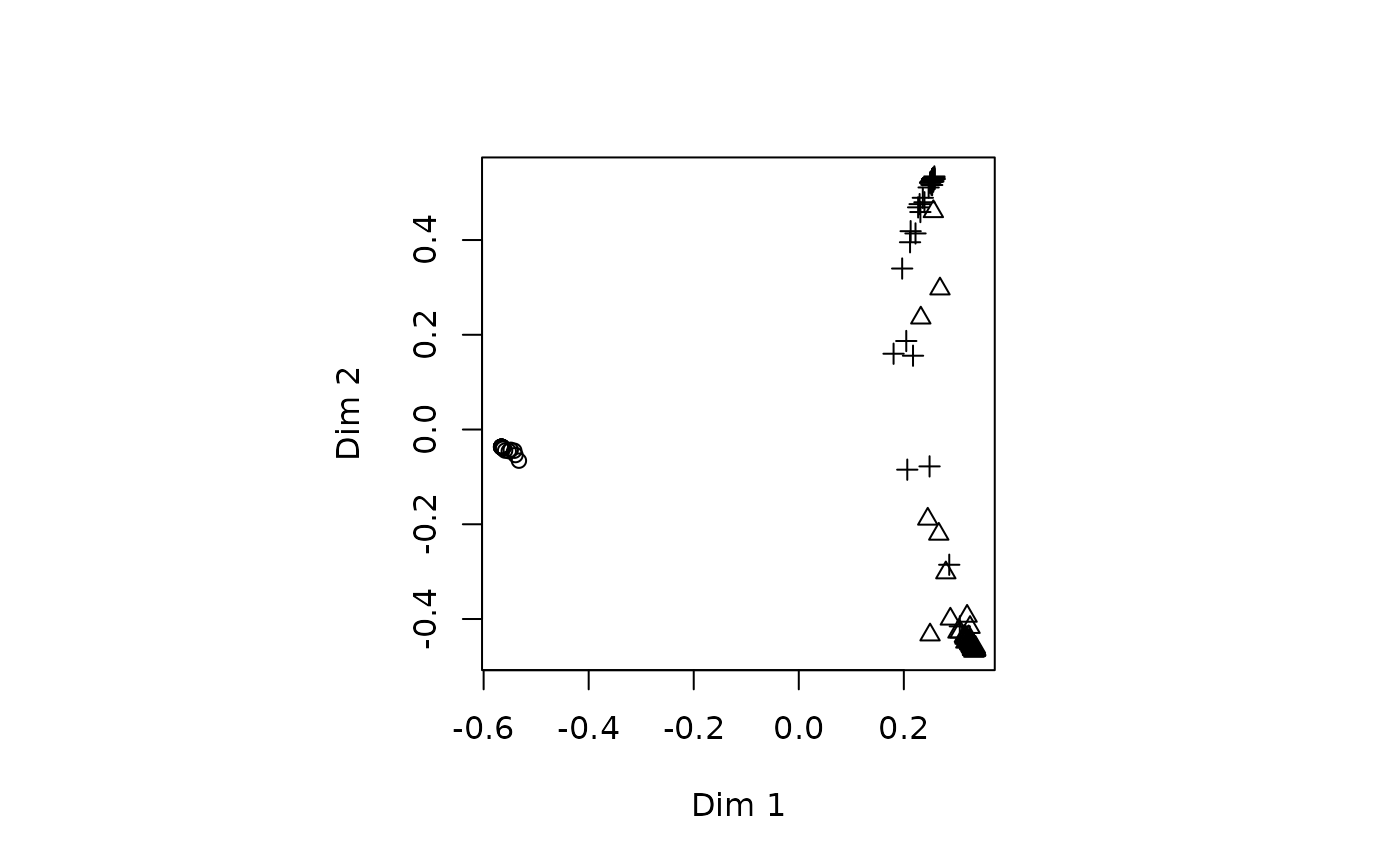
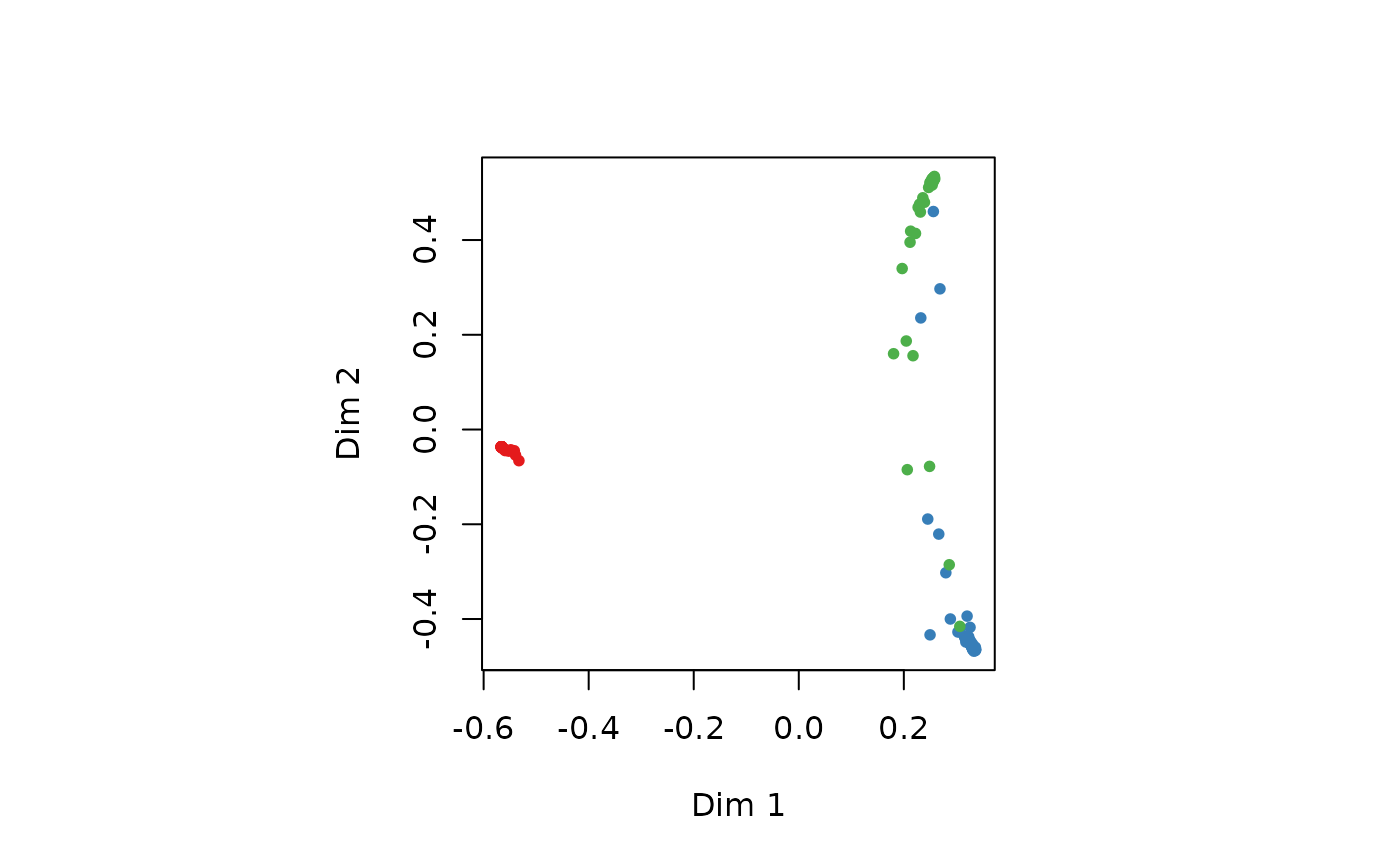
MDSplot(iris.rf, iris$Species)
 ## Using different symbols for the classes:
MDSplot(iris.rf, iris$Species, palette=rep(1, 3), pch=as.numeric(iris$Species))
## Using different symbols for the classes:
MDSplot(iris.rf, iris$Species, palette=rep(1, 3), pch=as.numeric(iris$Species))