Title Plot npsurv Nonparametric Survival Curves Using ggplot2
Source:R/ggplot.npsurv.r
ggplot.npsurv.RdTitle Plot npsurv Nonparametric Survival Curves Using ggplot2
# S3 method for class 'npsurv'
ggplot(
data,
mapping,
conf = c("bands", "none"),
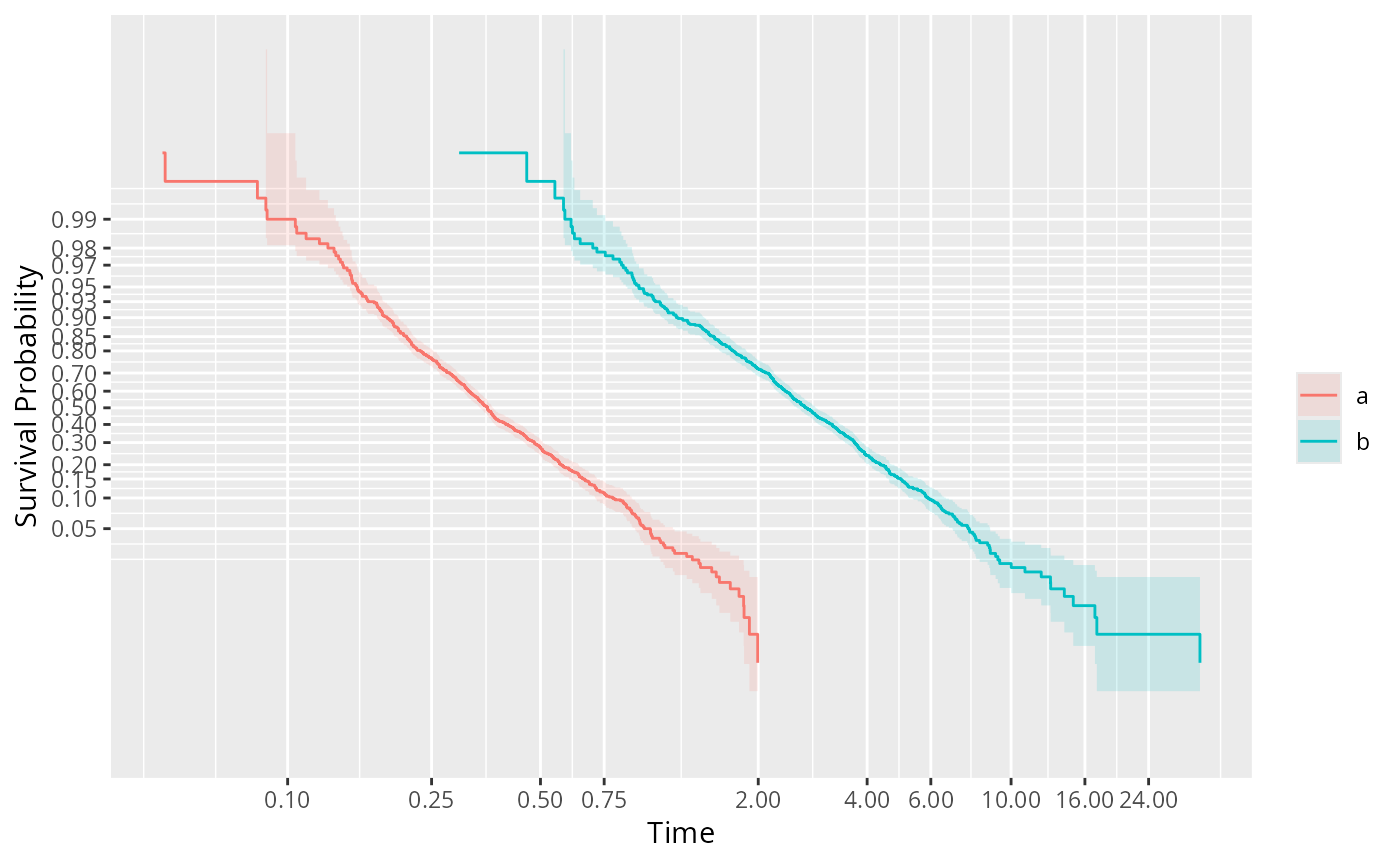
trans = c("identity", "logit", "probit", "loglog"),
logt = FALSE,
curtail = c(0, 1),
xlab,
ylab = "Survival Probability",
abbrev.label = FALSE,
levels.only = TRUE,
alpha = 0.15,
facet = FALSE,
npretty = 10,
onlydata = FALSE,
...,
environment
)Arguments
- data
the result of npsurv
- mapping
unused
- conf
set to
"none"to suppress confidence bands- trans
the name of a transformation for the survival probabilities to use in drawing the y-axis scale. The default is no transformation, and other choices are
"logit", "probit", "loglog"."loglog"represents \(-log(-log(S(t)))\)- logt
set to
TRUEto use a log scale for the x-axis- curtail
set to a (lower, upper) 2-vector to curtail survival probabilities and confidence limits before transforming and plotting
- xlab
x-axis label, the default coming from
fit- ylab
y-axis label, the default coming from
fit- abbrev.label
set to
TRUEto abbreviate strata levels- levels.only
set to
FALSEto keep the original strata name in the levels- alpha
transparency for confidence bands
- facet
when strata are present, set to
TRUEto facet them rather than using colors on one panel- npretty
the number of major tick mark labels to be constructed by
scales::breaks_pretty()orpretty(). For transformed scales, twice this number is used.- onlydata
set to
TRUEto return the data frame to be plotted, and no plot- ...
ignored
- environment
unused
Value
a ggplot2 object, if onlydata=FALSE