NOx Air Pollution Data
NOxEmissions.RdA typical medium sized environmental data set with hourly measurements of \(NOx\) pollution content in the ambient air.
data(NOxEmissions, package="robustbase")Format
A data frame with 8088 observations on the following 4 variables.
juldayday number, a factor with levels
373...730, typically with 24 hourly measurements.LNOx\(\log\) of hourly mean of NOx concentration in ambient air [ppb] next to a highly frequented motorway.
LNOxEm\(\log\) of hourly sum of NOx emission of cars on this motorway in arbitrary units.
sqrtWSSquare root of wind speed [m/s].
Details
The original data set had more observations, but with missing values.
Here, all cases with missing values were omitted
(na.omit(.)), and then only those were retained that
belonged to days with at least 20 (fully) observed hourly
measurements.
Source
René Locher (at ZHAW, Switzerland).
See also
another NOx dataset, ambientNOxCH.
Examples
data(NOxEmissions)
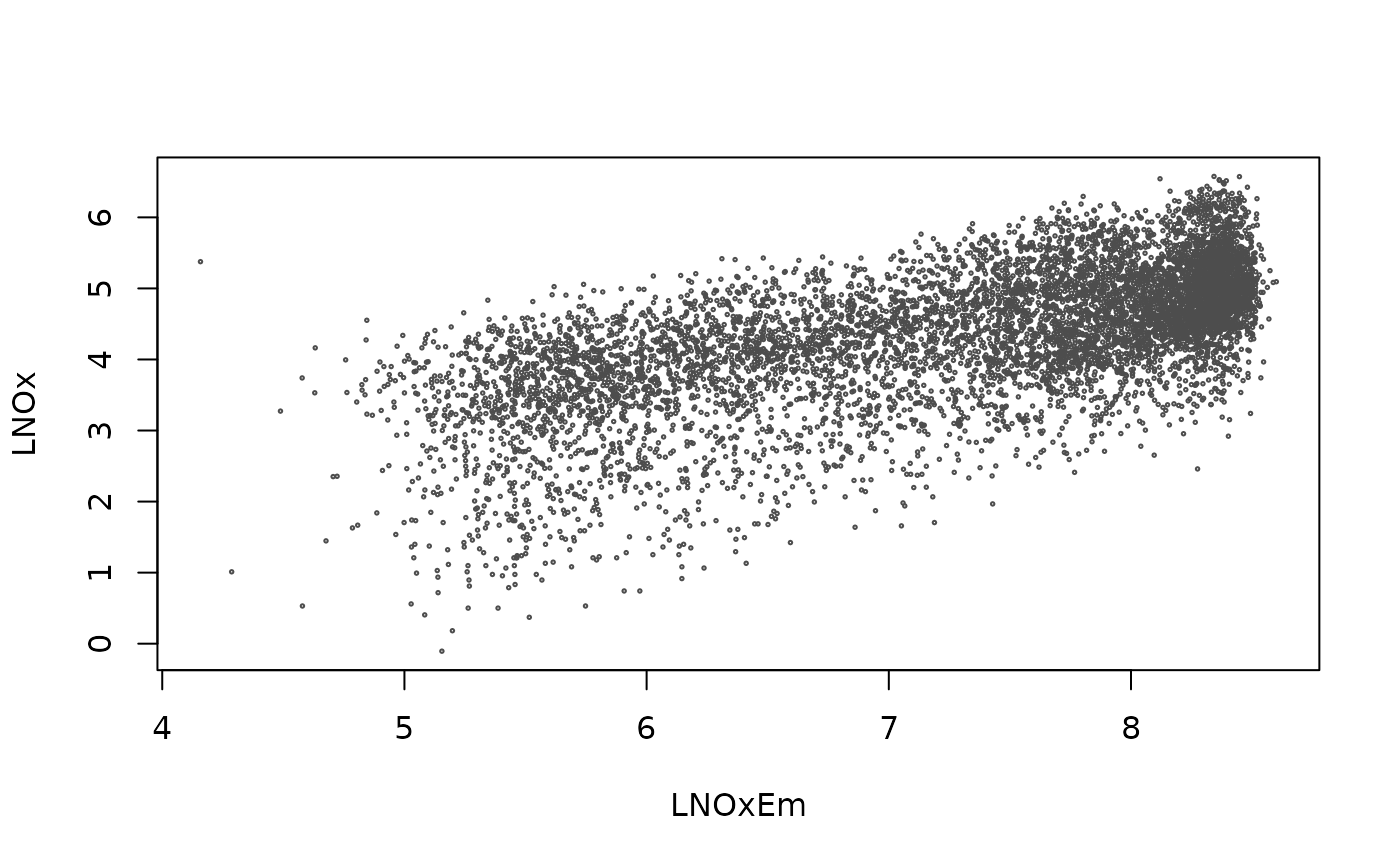
plot(LNOx ~ LNOxEm, data = NOxEmissions, cex = 0.25, col = "gray30")
 # \donttest{
## These examples take too much time and are not run during testing
## p = 340 ==> already Least Squares is not fast
if (FALSE) {
(lmNOx <- lm(LNOx ~ . ,data = NOxEmissions))
plot(lmNOx) #-> indication of 1 outlier
M.NOx <- MASS::rlm(LNOx ~ . , data = NOxEmissions)
## M-estimation works
## whereas MM-estimation fails:
try(MM.NOx <- MASS::rlm(LNOx ~ . , data = NOxEmissions, method = "MM"))
## namely because S-estimation fails:
try(lts.NOx <- ltsReg(LNOx ~ . , data = NOxEmissions))
try(lmR.NOx <- lmrob (LNOx ~ . , data = NOxEmissions))
}
# }
# \donttest{
## These examples take too much time and are not run during testing
## p = 340 ==> already Least Squares is not fast
if (FALSE) {
(lmNOx <- lm(LNOx ~ . ,data = NOxEmissions))
plot(lmNOx) #-> indication of 1 outlier
M.NOx <- MASS::rlm(LNOx ~ . , data = NOxEmissions)
## M-estimation works
## whereas MM-estimation fails:
try(MM.NOx <- MASS::rlm(LNOx ~ . , data = NOxEmissions, method = "MM"))
## namely because S-estimation fails:
try(lts.NOx <- ltsReg(LNOx ~ . , data = NOxEmissions))
try(lmR.NOx <- lmrob (LNOx ~ . , data = NOxEmissions))
}
# }