Compute correlation matrix with p-values. Numeric columns in the data are detected and automatically selected for the analysis. You can also specify variables of interest to be used in the correlation analysis.
Usage
cor_mat(
  data,
  ...,
  vars = NULL,
  method = "pearson",
  alternative = "two.sided",
  conf.level = 0.95
)

cor_pmat(
  data,
  ...,
  vars = NULL,
  method = "pearson",
  alternative = "two.sided",
  conf.level = 0.95
)

cor_get_pval(x)
Arguments
- data
a data.frame containing the variables.
- ...
One or more unquoted expressions (or variable names) separated by commas. Used to select a variable of interest.
- vars
a character vector containing the variable names of interest.
- method
a character string indicating which correlation coefficient is to be used for the test. One of
"pearson","kendall", or"spearman", can be abbreviated.- alternative
indicates the alternative hypothesis and must be one of
"two.sided","greater"or"less". You can specify just the initial letter."greater"corresponds to positive association,"less"to negative association.- conf.level
confidence level for the returned confidence interval. Currently only used for the Pearson product moment correlation coefficient if there are at least 4 complete pairs of observations.
- x
an object of class
cor_mat
Functions
cor_mat(): compute correlation matrix with p-values. Returns a data frame containing the matrix of the correlation coefficients. The output has an attribute named "pvalue", which contains the matrix of the correlation test p-values.cor_pmat(): compute the correlation matrix but returns only the p-values of the tests.cor_get_pval(): extract a correlation matrix p-values from an object of classcor_mat(). P-values are not adjusted.
Examples
# Data preparation
#:::::::::::::::::::::::::::::::::::::::::::
mydata <- mtcars %>%
select(mpg, disp, hp, drat, wt, qsec)
head(mydata, 3)
#> mpg disp hp drat wt qsec
#> Mazda RX4 21.0 160 110 3.90 2.620 16.46
#> Mazda RX4 Wag 21.0 160 110 3.90 2.875 17.02
#> Datsun 710 22.8 108 93 3.85 2.320 18.61
# Compute correlation matrix
#::::::::::::::::::::::::::::::::::::::::::
# Correlation matrix between all variables
cor.mat <- mydata %>% cor_mat()
cor.mat
#> # A tibble: 6 × 7
#> rowname mpg disp hp drat wt qsec
#> * <chr> <dbl> <dbl> <dbl> <dbl> <dbl> <dbl>
#> 1 mpg 1 -0.85 -0.78 0.68 -0.87 0.42
#> 2 disp -0.85 1 0.79 -0.71 0.89 -0.43
#> 3 hp -0.78 0.79 1 -0.45 0.66 -0.71
#> 4 drat 0.68 -0.71 -0.45 1 -0.71 0.091
#> 5 wt -0.87 0.89 0.66 -0.71 1 -0.17
#> 6 qsec 0.42 -0.43 -0.71 0.091 -0.17 1
# Specify some variables of interest
mydata %>% cor_mat(mpg, hp, wt)
#> # A tibble: 3 × 4
#> rowname mpg hp wt
#> * <chr> <dbl> <dbl> <dbl>
#> 1 mpg 1 -0.78 -0.87
#> 2 hp -0.78 1 0.66
#> 3 wt -0.87 0.66 1
# Or remove some variables in the data
# before the analysis
mydata %>% cor_mat(-mpg, -hp)
#> # A tibble: 4 × 5
#> rowname disp drat wt qsec
#> * <chr> <dbl> <dbl> <dbl> <dbl>
#> 1 disp 1 -0.71 0.89 -0.43
#> 2 drat -0.71 1 -0.71 0.091
#> 3 wt 0.89 -0.71 1 -0.17
#> 4 qsec -0.43 0.091 -0.17 1
# Significance levels
#::::::::::::::::::::::::::::::::::::::::::
cor.mat %>% cor_get_pval()
#> # A tibble: 6 × 7
#> rowname mpg disp hp drat wt qsec
#> <chr> <dbl> <dbl> <dbl> <dbl> <dbl> <dbl>
#> 1 mpg 0 9.38e-10 0.000000179 0.0000178 1.29e- 10 0.0171
#> 2 disp 9.38e-10 0 0.0000000714 0.00000528 1.22e- 11 0.0131
#> 3 hp 1.79e- 7 7.14e- 8 0 0.00999 4.15e- 5 0.00000577
#> 4 drat 1.78e- 5 5.28e- 6 0.00999 0 4.78e- 6 0.620
#> 5 wt 1.29e-10 1.22e-11 0.0000415 0.00000478 2.27e-236 0.339
#> 6 qsec 1.71e- 2 1.31e- 2 0.00000577 0.620 3.39e- 1 0
# Visualize
#::::::::::::::::::::::::::::::::::::::::::
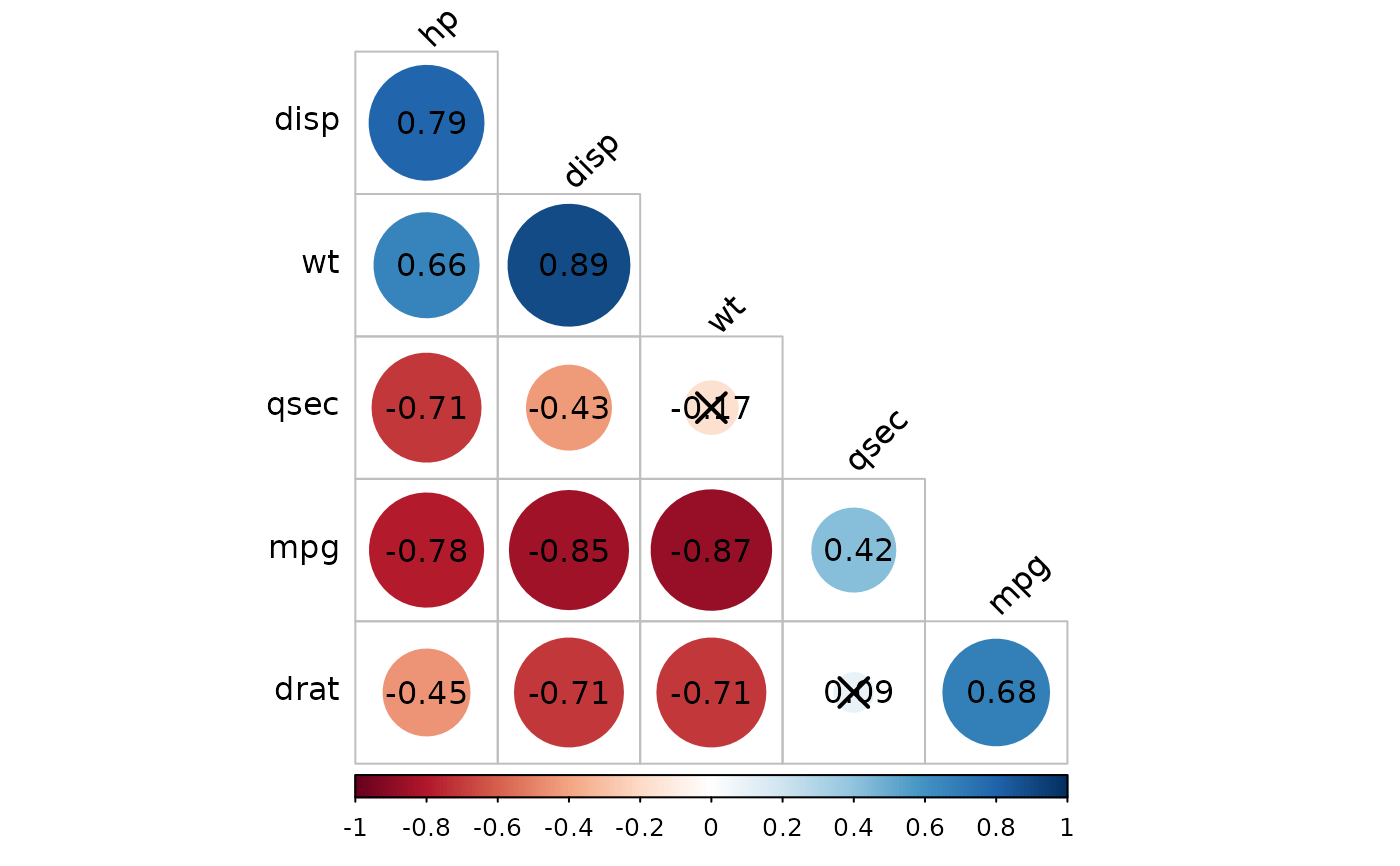
# Insignificant correlations are marked by crosses
cor.mat %>%
cor_reorder() %>%
pull_lower_triangle() %>%
cor_plot(label = TRUE)
 # Gather/collapse correlation matrix into long format
#::::::::::::::::::::::::::::::::::::::::::
cor.mat %>% cor_gather()
#> # A tibble: 36 × 4
#> var1 var2 cor p
#> <chr> <chr> <dbl> <dbl>
#> 1 mpg mpg 1 0
#> 2 disp mpg -0.85 9.38e-10
#> 3 hp mpg -0.78 1.79e- 7
#> 4 drat mpg 0.68 1.78e- 5
#> 5 wt mpg -0.87 1.29e-10
#> 6 qsec mpg 0.42 1.71e- 2
#> 7 mpg disp -0.85 9.38e-10
#> 8 disp disp 1 0
#> 9 hp disp 0.79 7.14e- 8
#> 10 drat disp -0.71 5.28e- 6
#> # ℹ 26 more rows
# Gather/collapse correlation matrix into long format
#::::::::::::::::::::::::::::::::::::::::::
cor.mat %>% cor_gather()
#> # A tibble: 36 × 4
#> var1 var2 cor p
#> <chr> <chr> <dbl> <dbl>
#> 1 mpg mpg 1 0
#> 2 disp mpg -0.85 9.38e-10
#> 3 hp mpg -0.78 1.79e- 7
#> 4 drat mpg 0.68 1.78e- 5
#> 5 wt mpg -0.87 1.29e-10
#> 6 qsec mpg 0.42 1.71e- 2
#> 7 mpg disp -0.85 9.38e-10
#> 8 disp disp 1 0
#> 9 hp disp 0.79 7.14e- 8
#> 10 drat disp -0.71 5.28e- 6
#> # ℹ 26 more rows