Quasi Randum Numbers via Halton Sequences
QUnif.RdThese functions provide quasi random numbers or space filling or low discrepancy sequences in the \(p\)-dimensional unit cube.
Usage
sHalton(n.max, n.min = 1, base = 2, leap = 1)
 QUnif (n, min = 0, max = 1, n.min = 1, p, leap = 1, silent = FALSE)
Arguments
- n.max
maximal (sequence) number.
- n.min
minimal sequence number.
- n
number of \(p\)-dimensional points generated in
QUnif. By default,n.min = 1, leap = 1and the maximal sequence number isn.max = n.min + (n-1)*leap.- base
integer \(\ge 2\): The base with respect to which the Halton sequence is built.
- min, max
lower and upper limits of the univariate intervals. Must be of length 1 or
p.- p
dimensionality of space (the unit cube) in which points are generated.
- leap
integer indicating (if \(> 1\)) if the series should be leaped, i.e., only every
leapth entry should be taken.- silent
logical asking to suppress the message about enlarging the prime table for large
p.
Value
sHalton(n,m) returns a numeric vector of length n-m+1 of
values in \([0,1]\).
QUnif(n, min, max, n.min, p=p) generates n-n.min+1
p-dimensional points in \([min,max]^p\) returning a numeric matrix
with p columns.
Note
For leap Kocis and Whiten recommend values of
\(L=31,61,149,409\), and particularly the \(L=409\) for dimensions
up to 400.
References
James Gentle (1998) Random Number Generation and Monte Carlo Simulation; sec.\ 6.3. Springer.
Kocis, L. and Whiten, W.J. (1997) Computational Investigations of Low-Discrepancy Sequences. ACM Transactions of Mathematical Software 23, 2, 266–294.
Examples
32*sHalton(20, base=2)
#> [1] 16 8 24 4 20 12 28 2 18 10 26 6 22 14 30 1 17 9 25 5
stopifnot(sHalton(20, base=3, leap=2) ==
sHalton(20, base=3)[1+2*(0:9)])
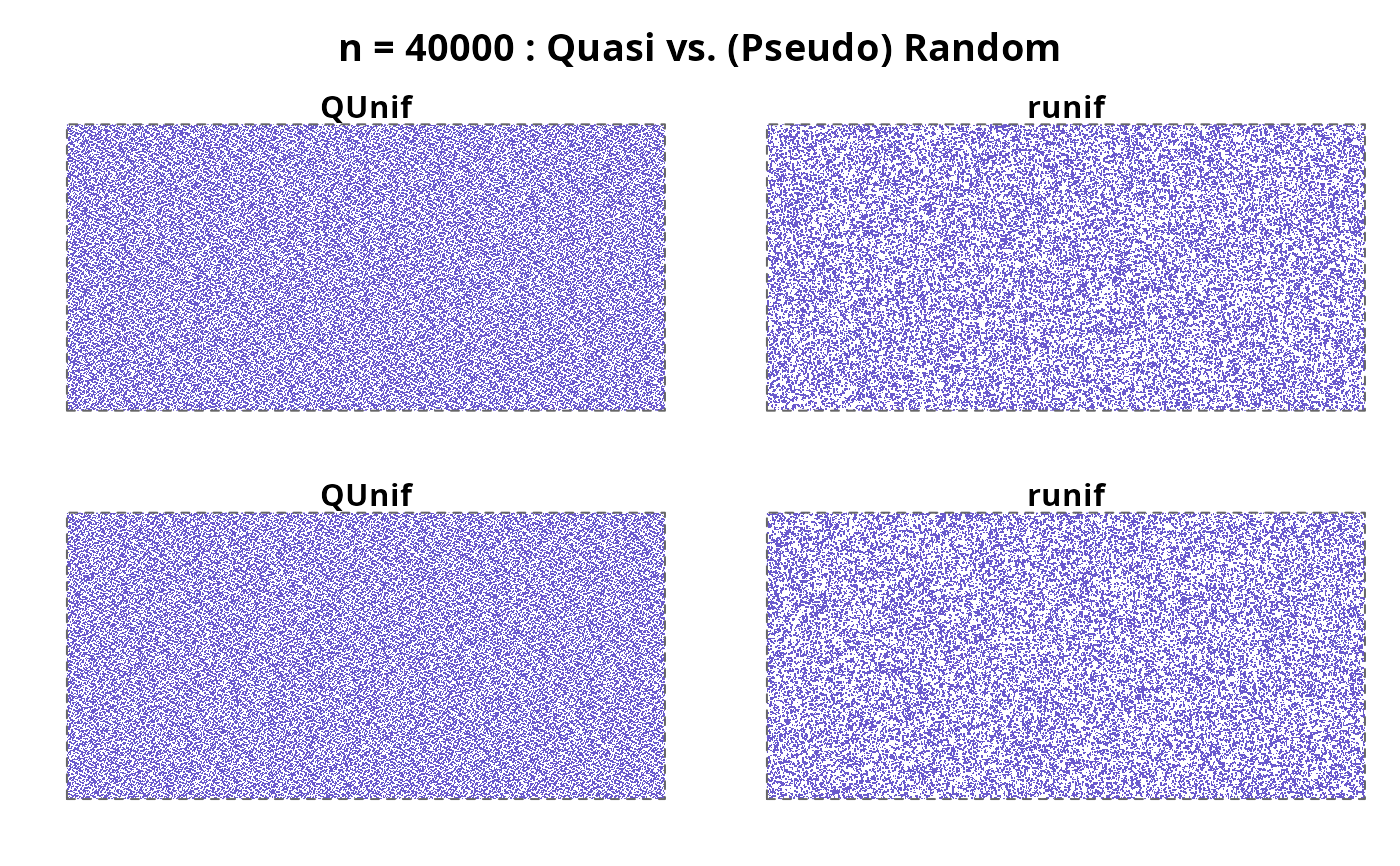
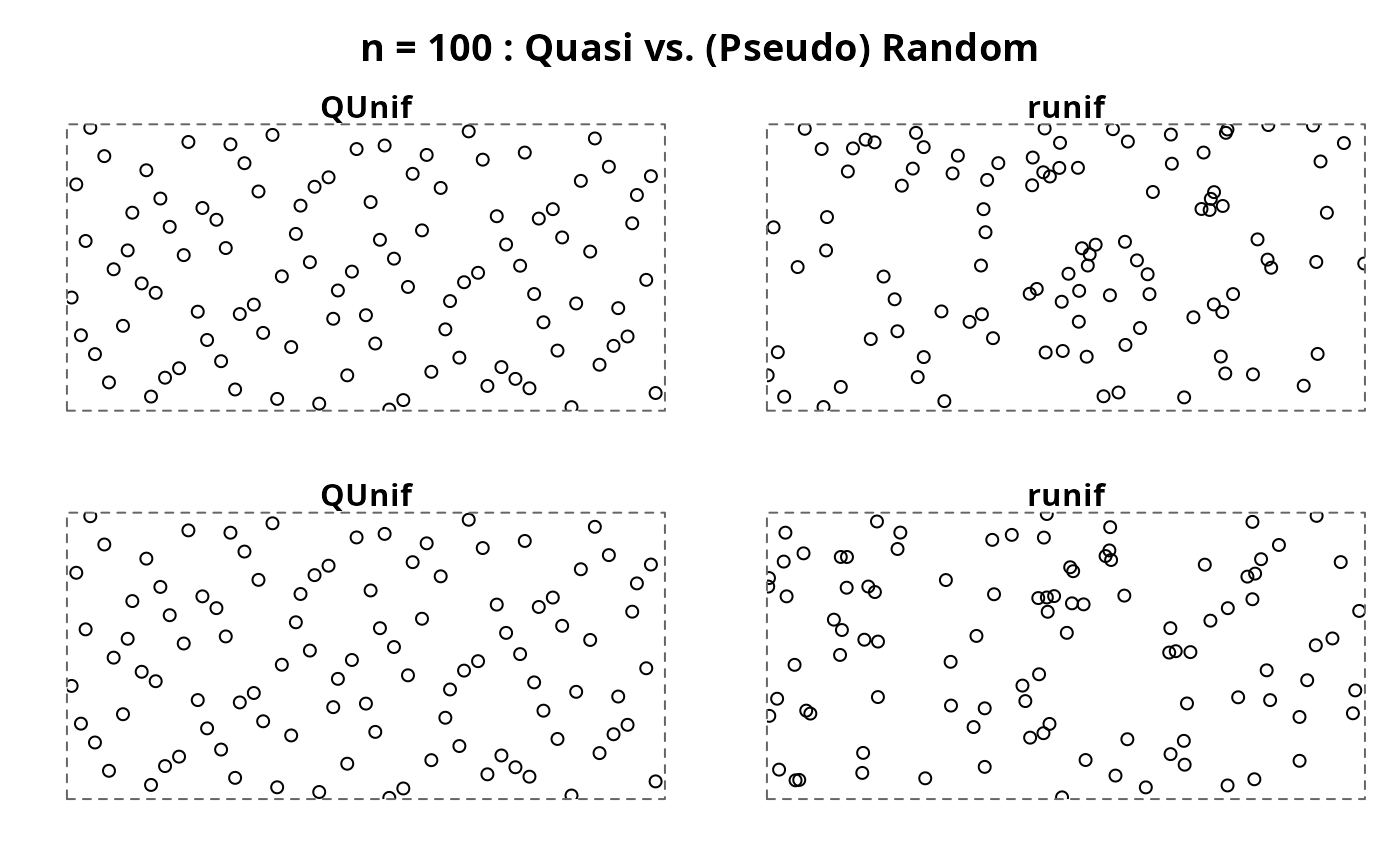
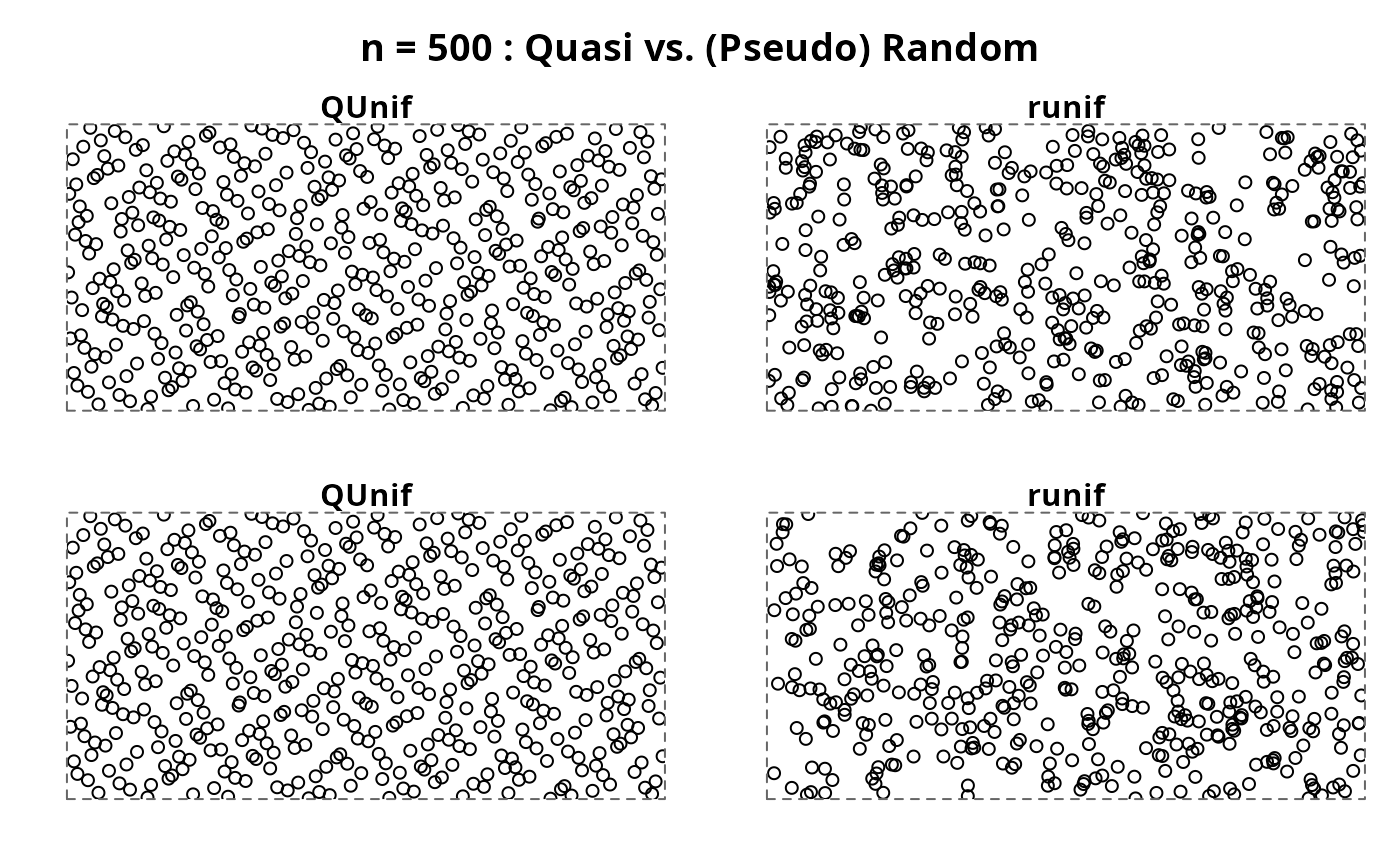
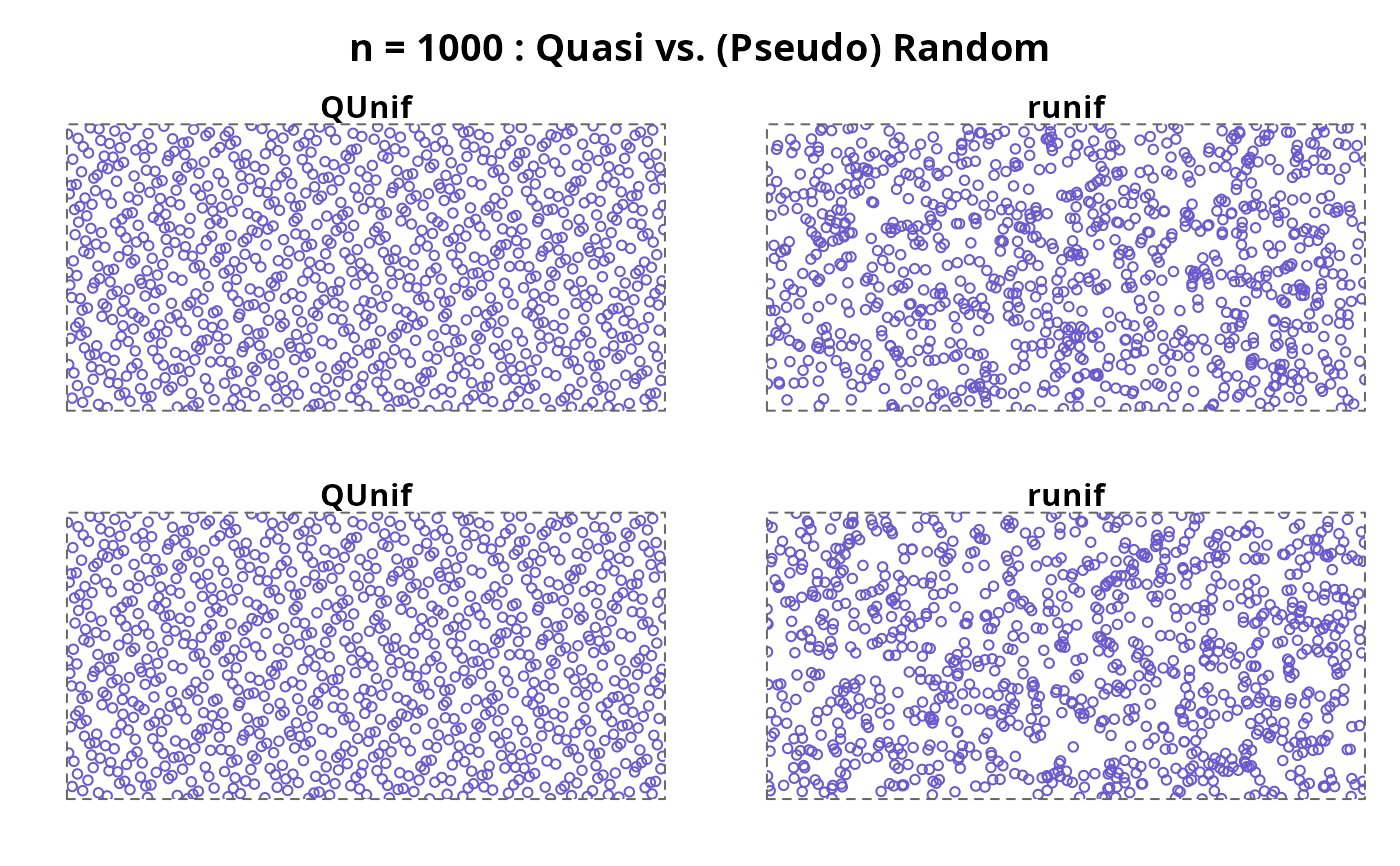
## ------- a 2D Visualization -------
Uplot <- function(xy, axes=FALSE, xlab="", ylab="", ...) {
plot(xy, xaxs="i", yaxs="i", xlim=0:1, ylim=0:1, xpd = FALSE,
axes=axes, xlab=xlab, ylab=ylab, ...)
box(lty=2, col="gray40")
}
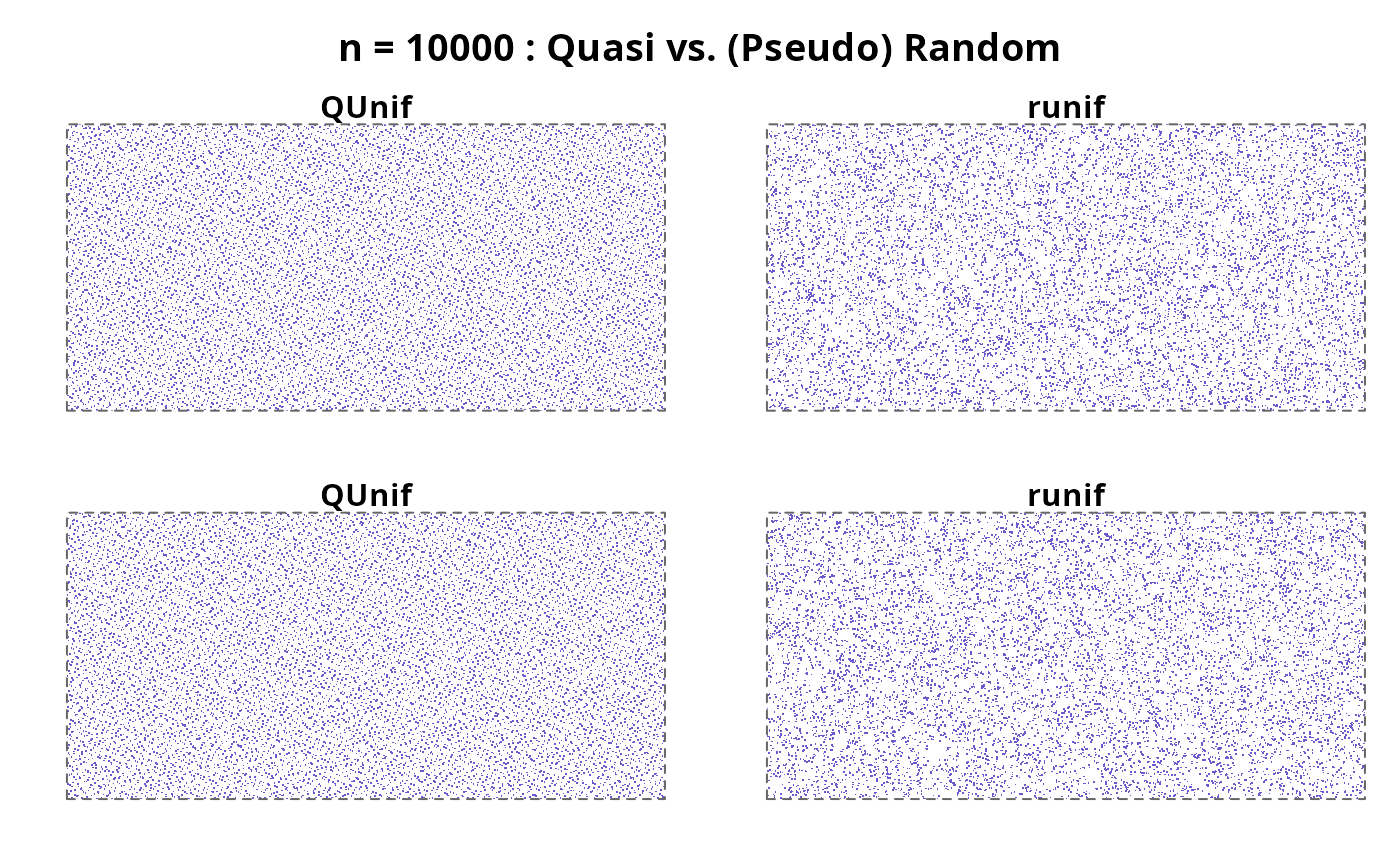
do4 <- function(n, ...) {
op <- mult.fig(4, main=paste("n =", n,": Quasi vs. (Pseudo) Random"),
marP=c(-2,-2,-1,0))$old.par
on.exit(par(op))
for(i in 1:2) {
Uplot(QUnif(n, p=2), main="QUnif", ...)
Uplot(cbind(runif(n), runif(n)), main="runif", ...)
}
}
do4(100)
 do4(500)
 do4(1000, cex = 0.8, col="slateblue")
 do4(10000, pch= ".", col="slateblue")
 do4(40000, pch= ".", col="slateblue")