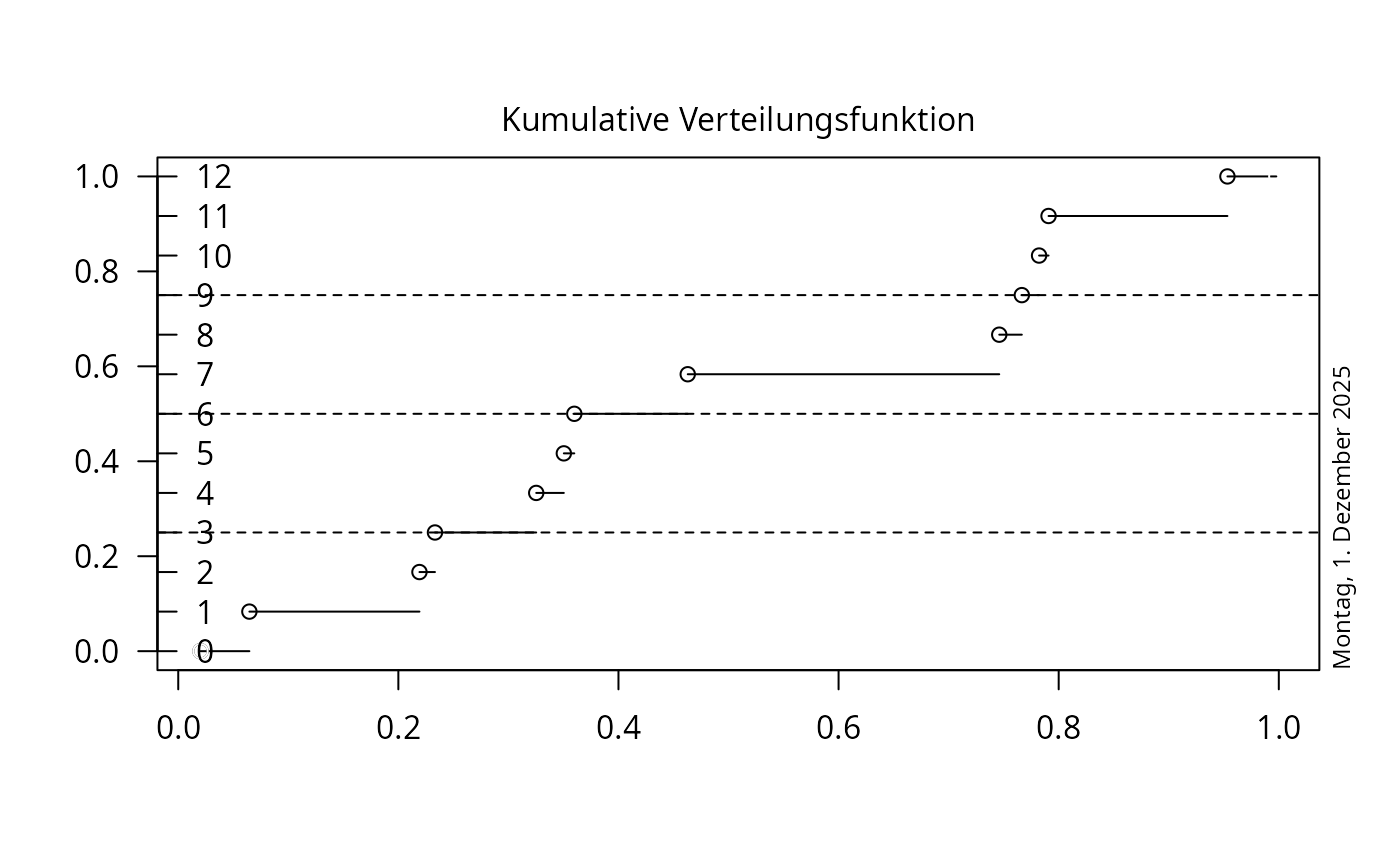
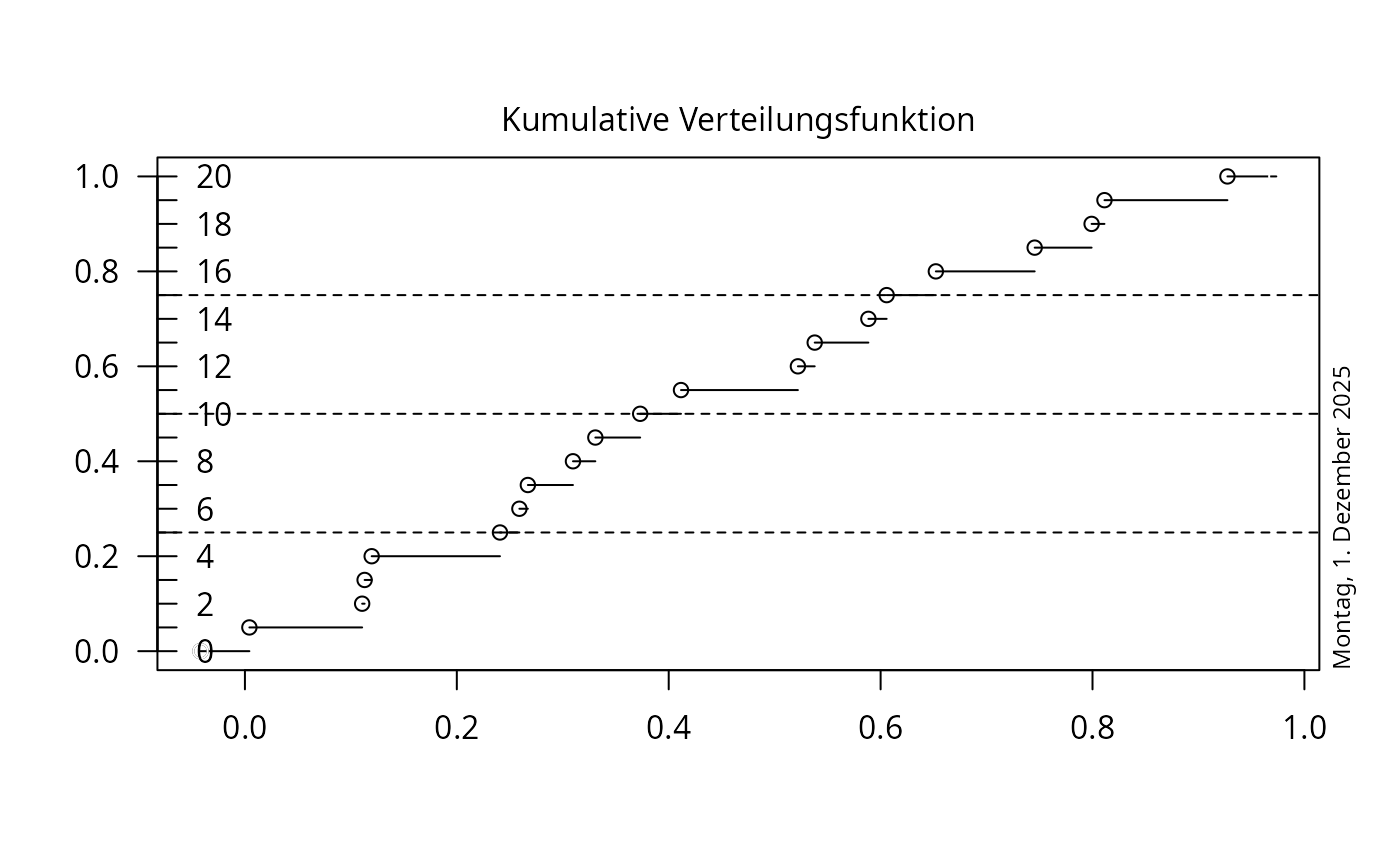
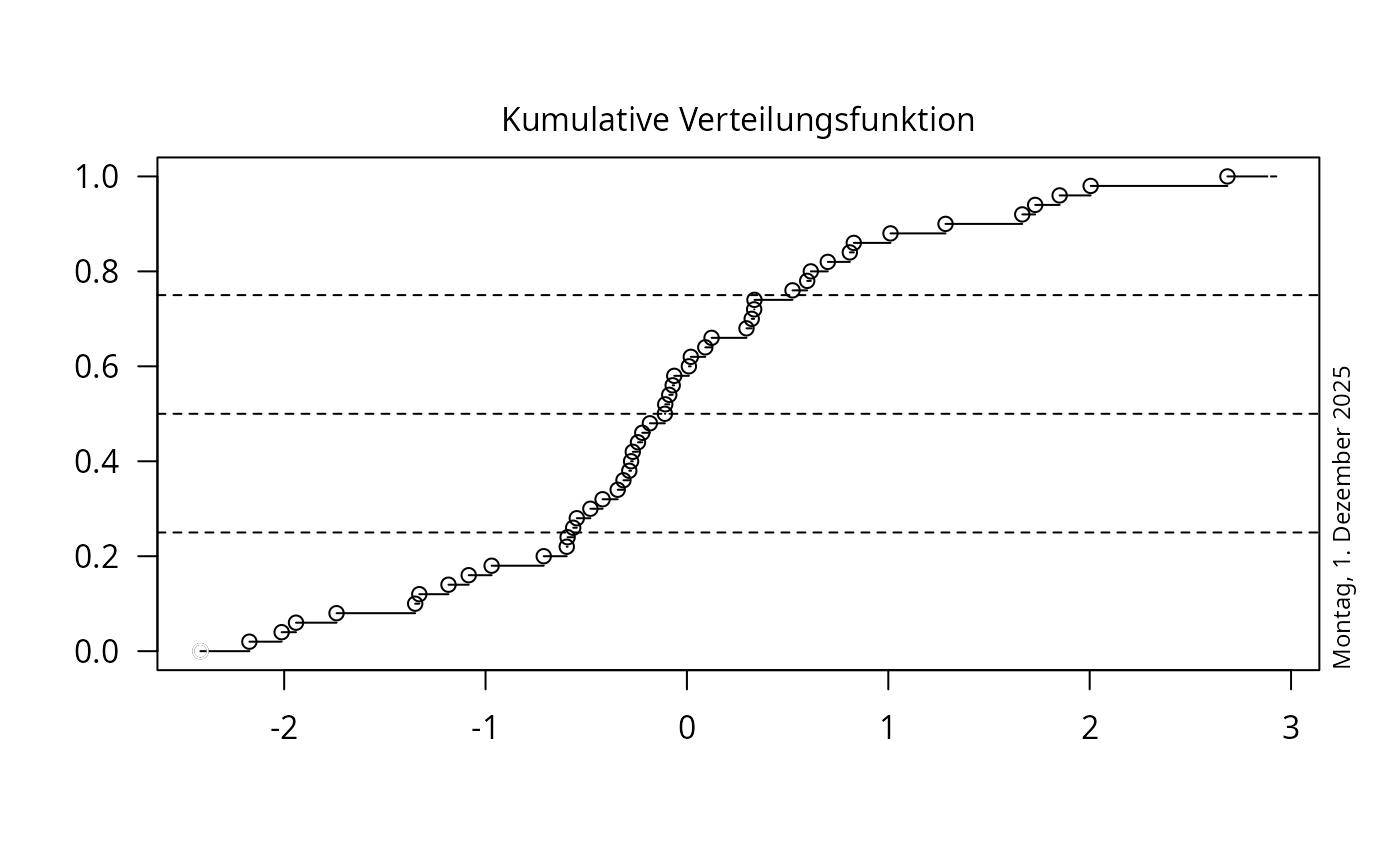
Kumulative Verteilung Aufzeichnen
cum.Vert.funkt.RdKumulative Verteilung von x aufzeichnen, auf Wunsch auch Median
und Quartile.
This is just an old German language version of
plot.ecdf() used for teaching at ETHZ.
Usage
cum.Vert.funkt(x, Quartile = TRUE, titel = TRUE, Datum = TRUE,
               rang.axis = n <= 20, xlab = "", main = "", ...)
Arguments
- x
numeric vector whose empirical distribution should be plotted.
- Quartile
logical indicating if all 3 non-trivial quartiles should be drawn.
- titel
logical indicating if a German title should be drawn.
- Datum
logical indicating if
p.datumshould be added.- rang.axis
logical indicating if all the ranks should be marked at the y-axis. Defaults to true if there are not more than 20 observations.
- xlab, main
x-axis label and main title; default to empty.
- ...
optional further arguments, passed to
plotStep.
Value
the return value of plotStep() which is called
internally, invisibly.
See also
plotStep on which it is based; but you should
really consider using plot.ecdf() from the
stats package instead of this.