Name Plot: Names or Numbers instead of Points in Plot
n.plot.RdA utility function which basically calls plot(*, type="n")
and text. To have names or numbers instead of points
in a plot is useful for identifaction, e.g., in a residual plot, see
also TA.plot.
Arguments
- x, y
coordinates at which to plot. If
yis missing,xis used for both, if it's adata.frame, list, 2-column matrix etc – viaxy.coords; formula do not work.- nam
the labels to plot at each (x,y). Per default, these taken from the data
xandy; case numbers1:nare taken if no names are available.- abbr
logical indicating if the
namlabels should be abbreviated – with a sensible default.- type
passed to
plot.default,a string denoting the type of the initialplot()call; the default draws nothing but the axes, etc;type = "l"maybe useful occasionally.- xlab, ylab
labels for the x- and y- axis, the latter being empty by default.
- log
character specifying if log scaled axes should be used, see
plot.default.- cex
plotting character expansion, see
par.- col
color to use for
text().- pt.col
color to use for
plot()iftypeis set different to"n".- ...
further arguments to be passed to the
plotcall.
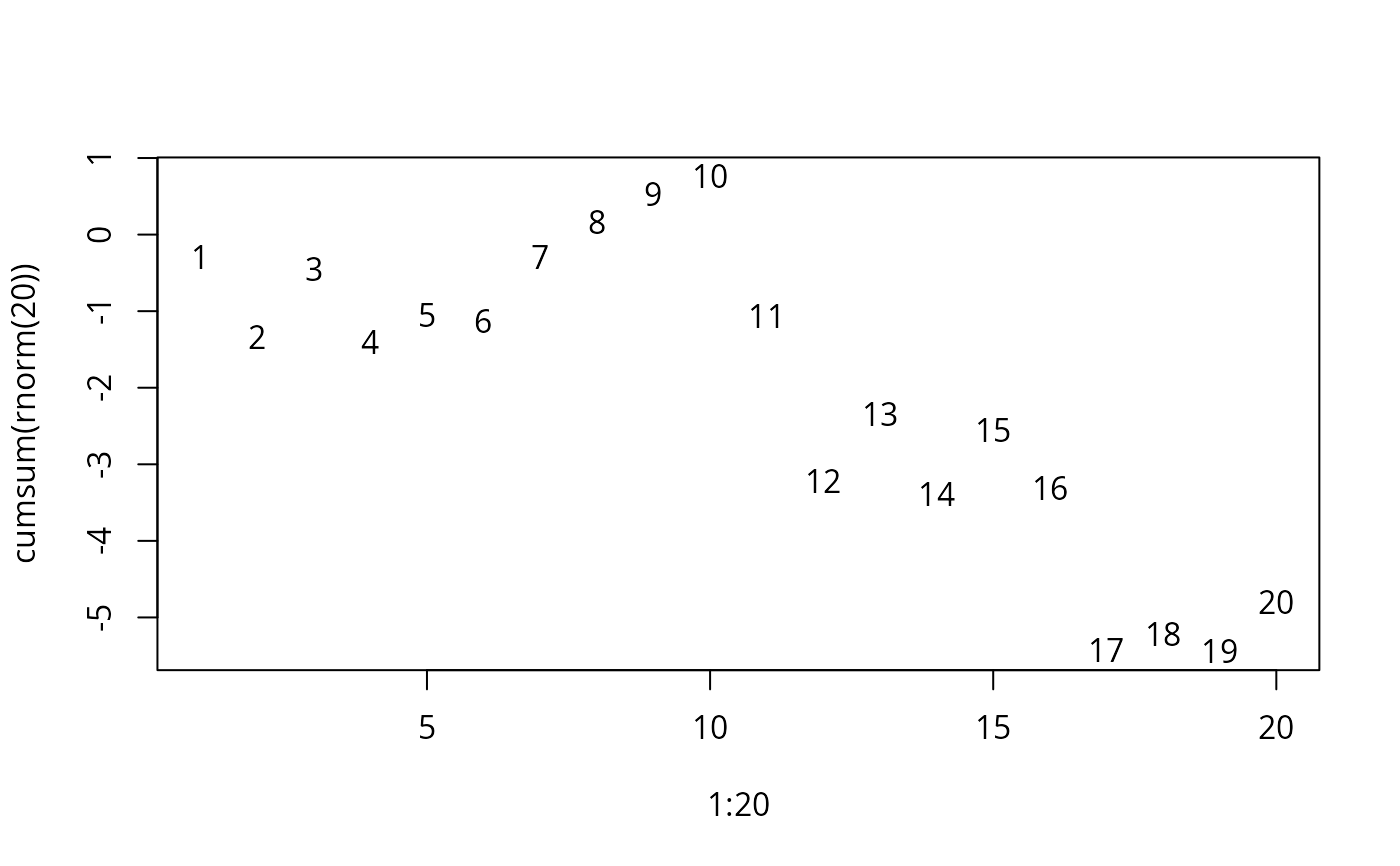
Examples
n.plot(1:20, cumsum(rnorm(20)))
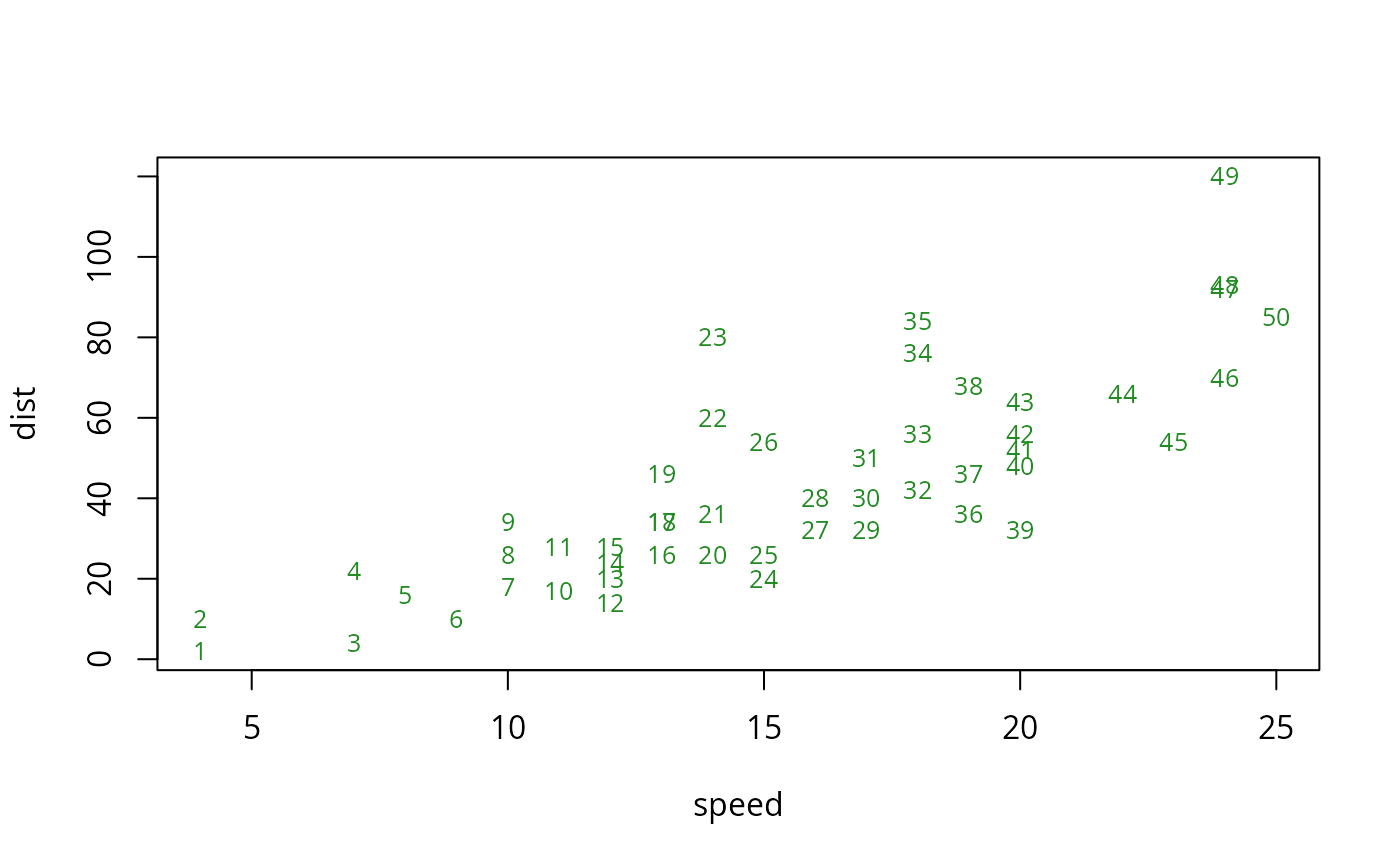
 data(cars)
with(cars, n.plot(speed, dist, cex = 0.8, col = "forest green"))
data(cars)
with(cars, n.plot(speed, dist, cex = 0.8, col = "forest green"))
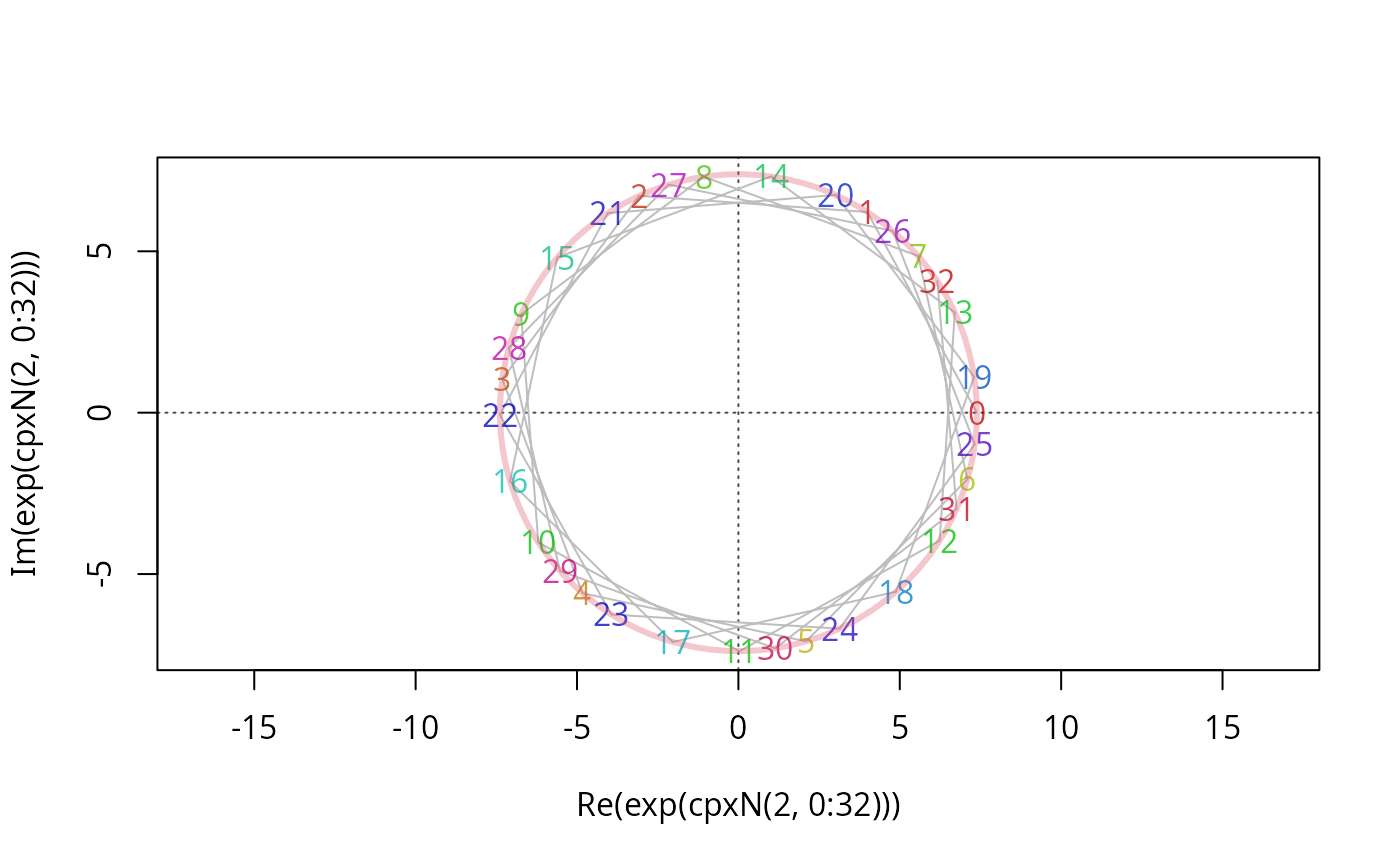
 ## visualize periodicity of exp(<complex>) {pass args to plot.default() via `...`}
cpxN <- function(r,i) setNames(complex(real=r, imaginary=i), i)
n.plot(exp(cpxN(2, 0:32)), type = "l", pt.col = "gray", asp = 1,
col = adjustcolor(rainbow(33), offset = rep(-1/4, 4)),
panel.first = abline(h=0, v=0, lty=3, col="gray30"))
symbols(0,0, circles = exp(2), inches=FALSE, fg = adjustcolor(2, 1/3), lwd=3, add=TRUE)
## visualize periodicity of exp(<complex>) {pass args to plot.default() via `...`}
cpxN <- function(r,i) setNames(complex(real=r, imaginary=i), i)
n.plot(exp(cpxN(2, 0:32)), type = "l", pt.col = "gray", asp = 1,
col = adjustcolor(rainbow(33), offset = rep(-1/4, 4)),
panel.first = abline(h=0, v=0, lty=3, col="gray30"))
symbols(0,0, circles = exp(2), inches=FALSE, fg = adjustcolor(2, 1/3), lwd=3, add=TRUE)