Find all Primes Less Than n
primes.RdFind all prime numbers aka ‘primes’ less than \(n\).
Uses an obvious sieve method (and some care), working with
logical and and integers to be quite fast.
Details
As the function only uses max(n), n can also be a
vector of numbers.
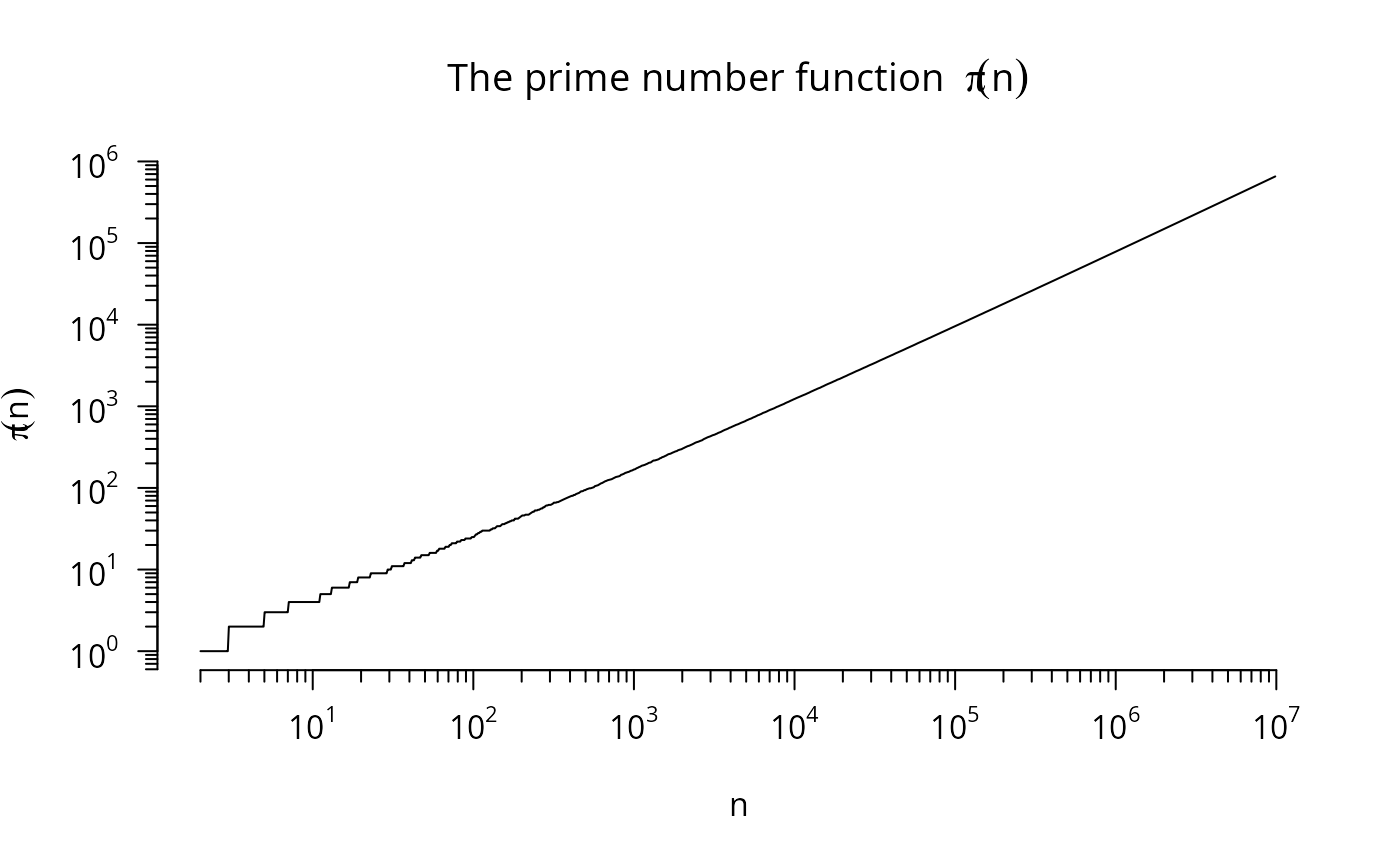
The famous prime number theorem states that \(\pi(n)\), the number of primes below \(n\) is asymptotically \(n / \log(n)\) in the sense that \(\lim_{n \to \infty}{\pi(n) \cdot \log(n) / n \sim 1}\).
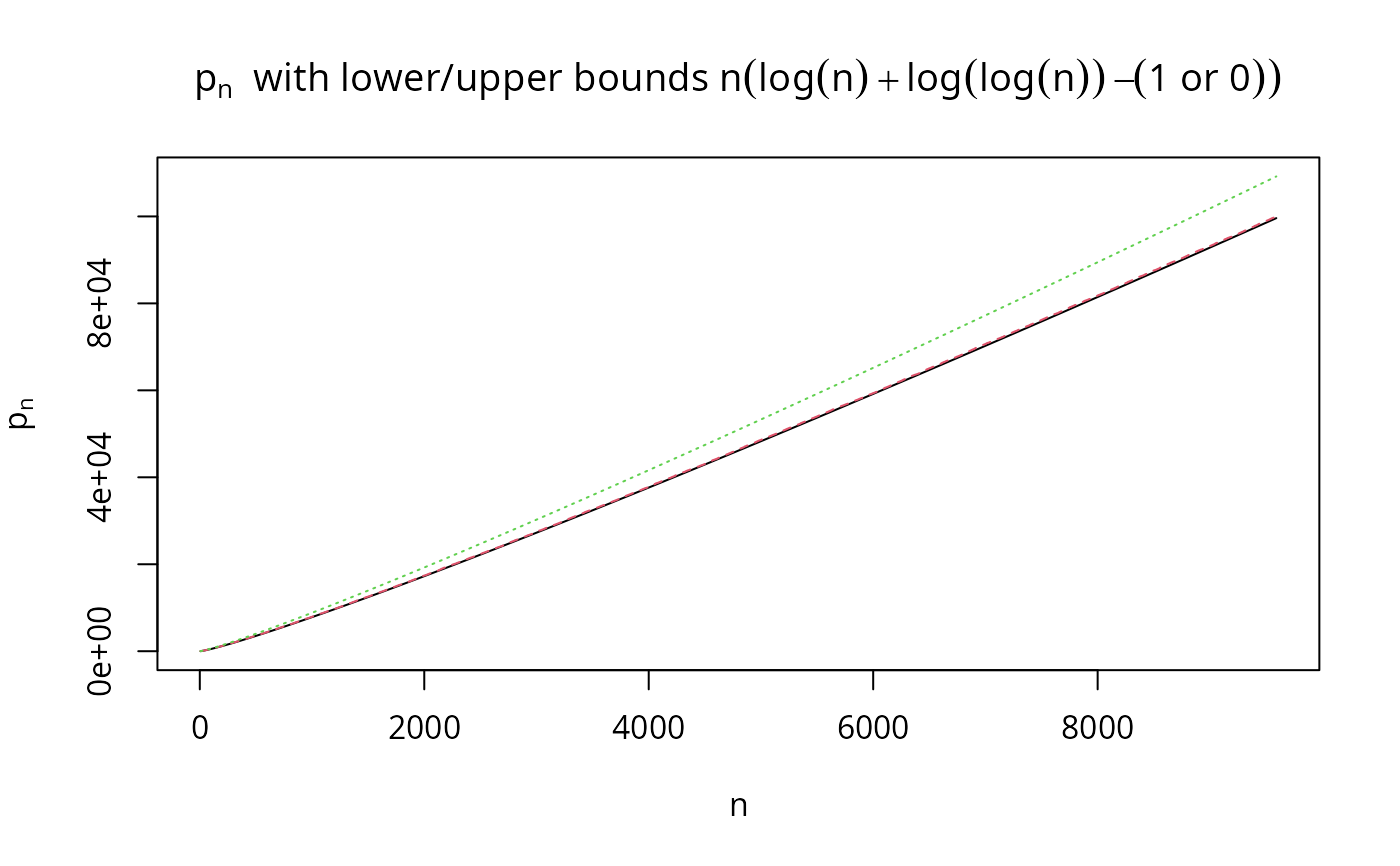
Equivalently, the inverse of \(pi()\), the \(n\)-th prime number \(p_n\) is around \(n \log n\); recent results (Pierre Dusart, 1999), prove that $$\log n + \log\log n - 1 < \frac{p_n}{n} < \log n + \log \log n \quad\mathrm{for } n \ge 6.$$
Author
Bill Venables (<= 2001); Martin Maechler gained another 40% speed, carefully working with logicals and integers.
Examples
(p1 <- primes(100))
#> [1] 2 3 5 7 11 13 17 19 23 29 31 37 41 43 47 53 59 61 67 71 73 79 83 89 97
system.time(p1k <- primes(1000)) # still lightning fast
#> user system elapsed
#> 0.003 0.000 0.003
stopifnot(length(p1k) == 168)
# \donttest{
system.time(p.e7 <- primes(1e7)) # still only 0.3 sec (2015 (i7))
#> user system elapsed
#> 0.412 0.031 0.443
stopifnot(length(p.e7) == 664579)
## The famous pi(n) := number of primes <= n:
pi.n <- approxfun(p.e7, seq_along(p.e7), method = "constant")
pi.n(c(10, 100, 1000)) # 4 25 168
#> [1] 4 25 168
plot(pi.n, 2, 1e7, n = 1024, log="xy", axes = FALSE,
xlab = "n", ylab = quote(pi(n)),
main = quote("The prime number function " ~ pi(n)))
eaxis(1); eaxis(2)
 # }
## Exploring p(n) := the n-th prime number ~=~ n * pnn(n), where
## pnn(n) := log n + log log n
pnn <- function(n) { L <- log(n); L + log(L) }
n <- 6:(N <- length(PR <- primes(1e5)))
m.pn <- cbind(l.pn = ceiling(n*(pnn(n)-1)), pn = PR[n], u.pn = floor(n*pnn(n)))
matplot(n, m.pn, type="l", ylab = quote(p[n]), main = quote(p[n] ~~
"with lower/upper bounds" ~ n*(log(n) + log(log(n)) -(1~"or"~0))))
# }
## Exploring p(n) := the n-th prime number ~=~ n * pnn(n), where
## pnn(n) := log n + log log n
pnn <- function(n) { L <- log(n); L + log(L) }
n <- 6:(N <- length(PR <- primes(1e5)))
m.pn <- cbind(l.pn = ceiling(n*(pnn(n)-1)), pn = PR[n], u.pn = floor(n*pnn(n)))
matplot(n, m.pn, type="l", ylab = quote(p[n]), main = quote(p[n] ~~
"with lower/upper bounds" ~ n*(log(n) + log(log(n)) -(1~"or"~0))))
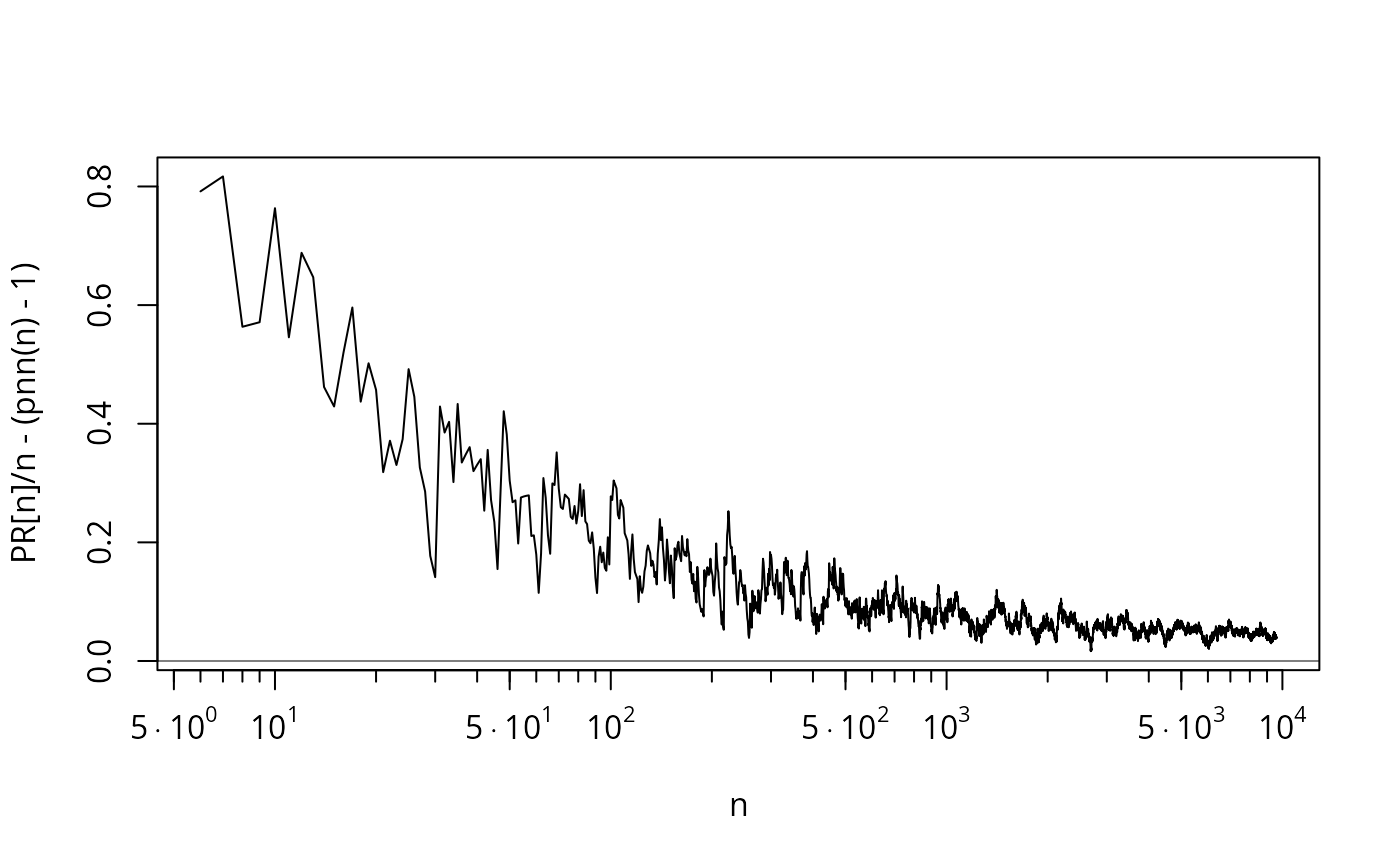
 ## (difference to the lower approximation) / n --> ~ 0.0426 (?) :
plot(n, PR[n]/n - (pnn(n)-1), type = 'l', cex = 1/8, log="x", xaxt="n")
eaxis(1); abline(h=0, col=adjustcolor(1, 0.5))
## (difference to the lower approximation) / n --> ~ 0.0426 (?) :
plot(n, PR[n]/n - (pnn(n)-1), type = 'l', cex = 1/8, log="x", xaxt="n")
eaxis(1); abline(h=0, col=adjustcolor(1, 0.5))