Simulate Binomial spatial point process.
Arguments
- n
number of points
Value
list of vectors of x and y coordinates.
Details
relies on the region being set by ppinit or ppregion.
References
Ripley, B. D. (1981) Spatial Statistics. Wiley.
Venables, W. N. and Ripley, B. D. (2002)
Modern Applied Statistics with S. Fourth edition. Springer.
Side Effects
uses the random number generator.
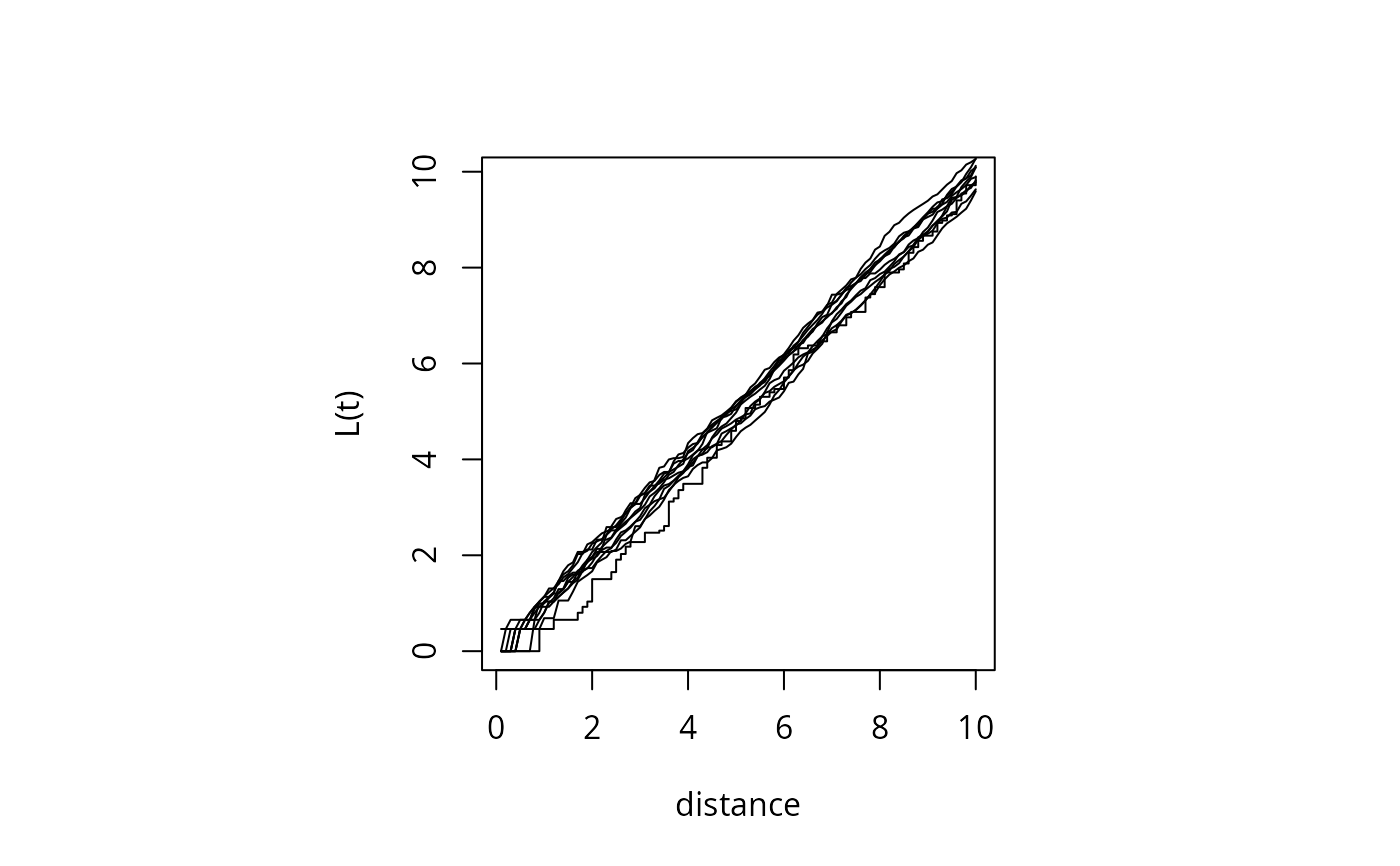
Examples
towns <- ppinit("towns.dat")
par(pty="s")
plot(Kfn(towns, 10), type="s", xlab="distance", ylab="L(t)")
for(i in 1:10) lines(Kfn(Psim(69), 10))