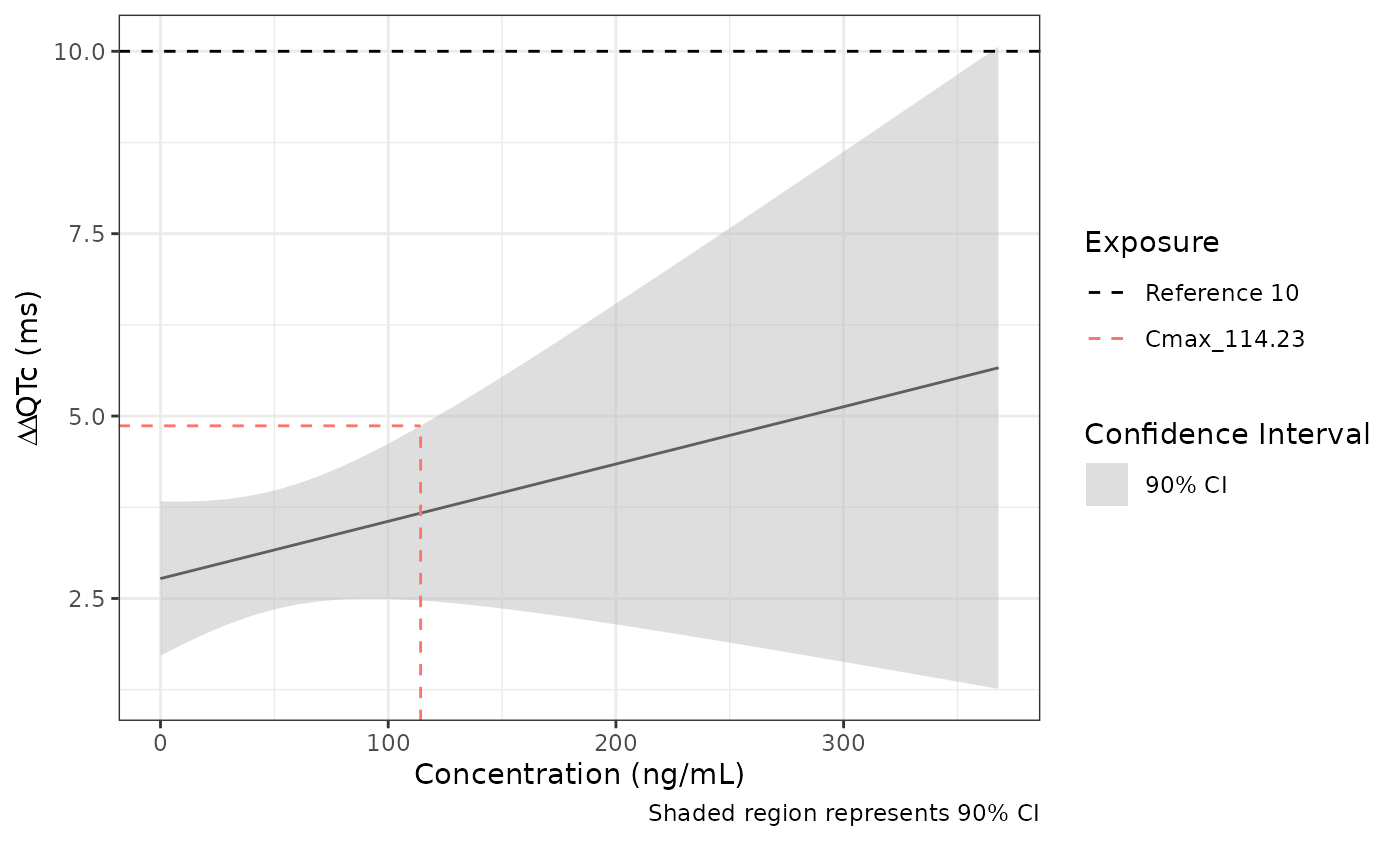
Plots model predictions with therapeutic and supra therapeutic Cmax
predict_with_exposure_plot.RdPlots model predictions with therapeutic and supra therapeutic Cmax
Arguments
- data
A data frame containing C-QT analysis dataset
- fit
An nlme::lme model object from model fitting
- conc_col
An unquoted column name for drug concentration measurements
- treatment_predictors
List of a values for contrast. CONC will update
- control_predictors
List of b values for contrast
- reference_threshold
Optional vector of numbers to add as horizontal dashed lines
- cmaxes
Optional - numeric vector of Cmax values to add as reference lines
- conf_int
Numeric confidence interval level (default: 0.9)
- style
A named list of arguments passed to style_plot()
Value
a plot
Examples
data_proc <- preprocess(cqtkit_data_verapamil)
fit <- fit_prespecified_model(
  data_proc,
  deltaQTCF,
  ID,
  CONC,
  deltaQTCFBL,
  TRTG,
  TAFD,
  "REML",
  TRUE
)
pk_df <- compute_pk_parameters(
  data_proc %>% dplyr::filter(DOSE != 0), ID, DOSEF, CONC, NTLD)

predict_with_exposure_plot(
  data_proc,
  fit,
  CONC,
  treatment_predictors = list(
    CONC = 0,
    deltaQTCFBL = 0,
    TRTG = "Verapamil HCL",
    TAFD = "2 HR"
  ),
  control_predictors = list(
    CONC = 0,
    deltaQTCFBL = 0,
    TRTG = "Placebo",
    TAFD = "2 HR"
  ),
  cmaxes = pk_df[[1, "Cmax_gm"]], # Dose = 120
)