Autoplot PCA-likes
# S3 method for class 'pca_common'
autoplot(
  object,
  data = NULL,
  scale = 1,
  x = 1,
  y = 2,
  variance_percentage = TRUE,
  ...
)
Arguments
- object
PCA-like instance
- data
Joined to fitting result if provided.
- scale
scaling parameter, disabled by 0
- x
principal component number used in x axis
- y
principal component number used in y axis
- variance_percentage
show the variance explained by the principal component?
- ...
other arguments passed to [ggbiplot()]
Examples
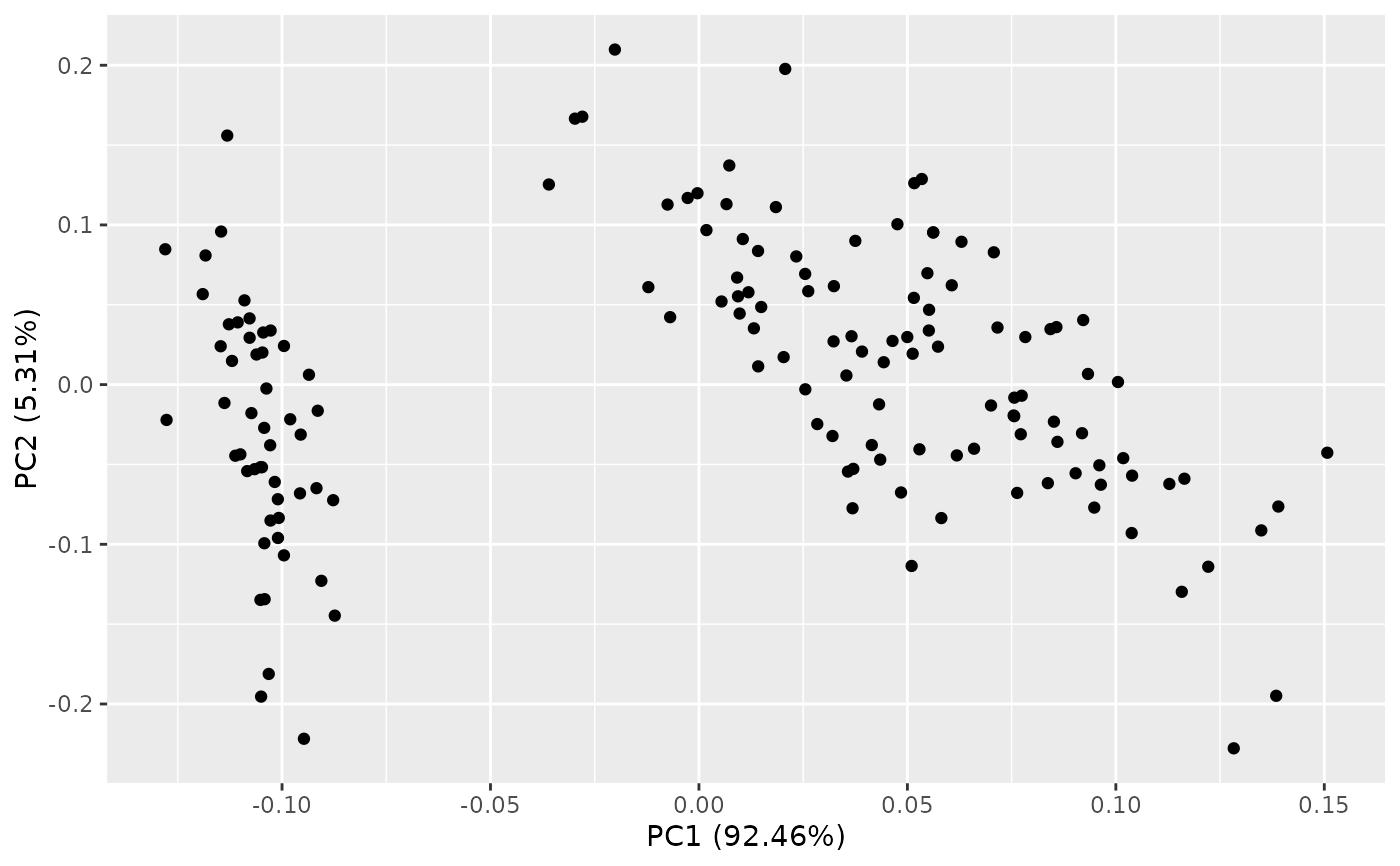
autoplot(stats::prcomp(iris[-5]))
 autoplot(stats::prcomp(iris[-5]), data = iris)
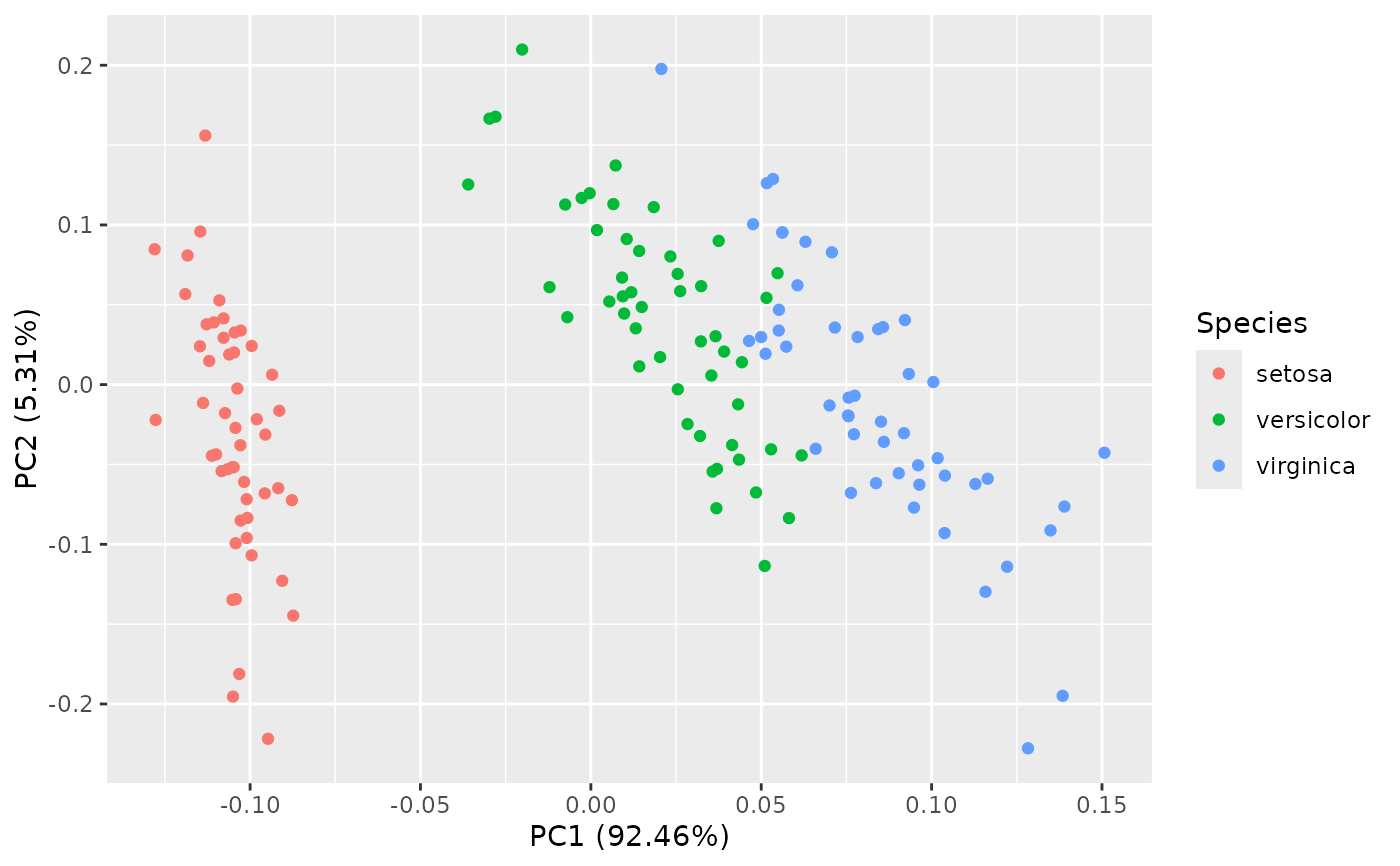
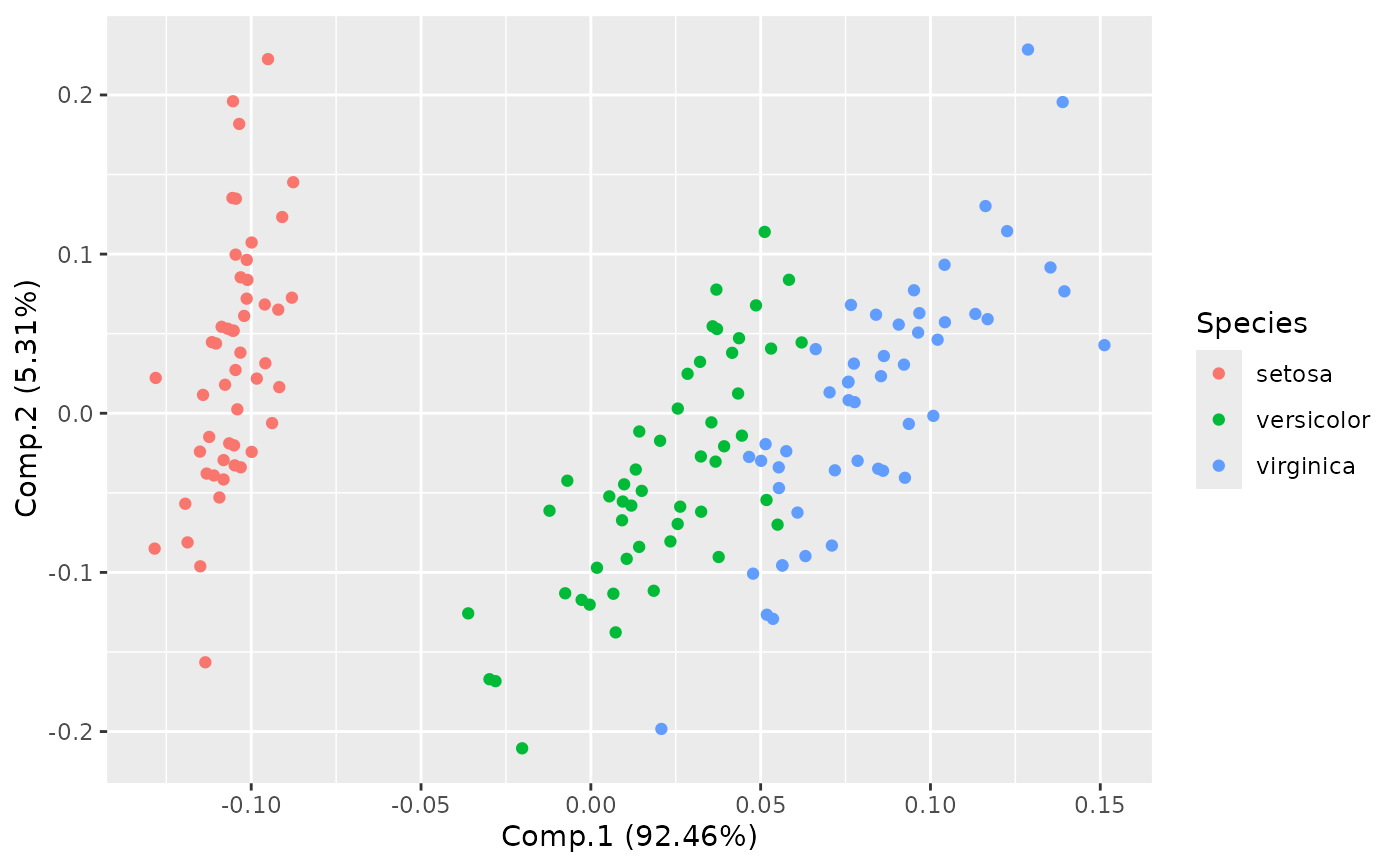
 autoplot(stats::prcomp(iris[-5]), data = iris, colour = 'Species')
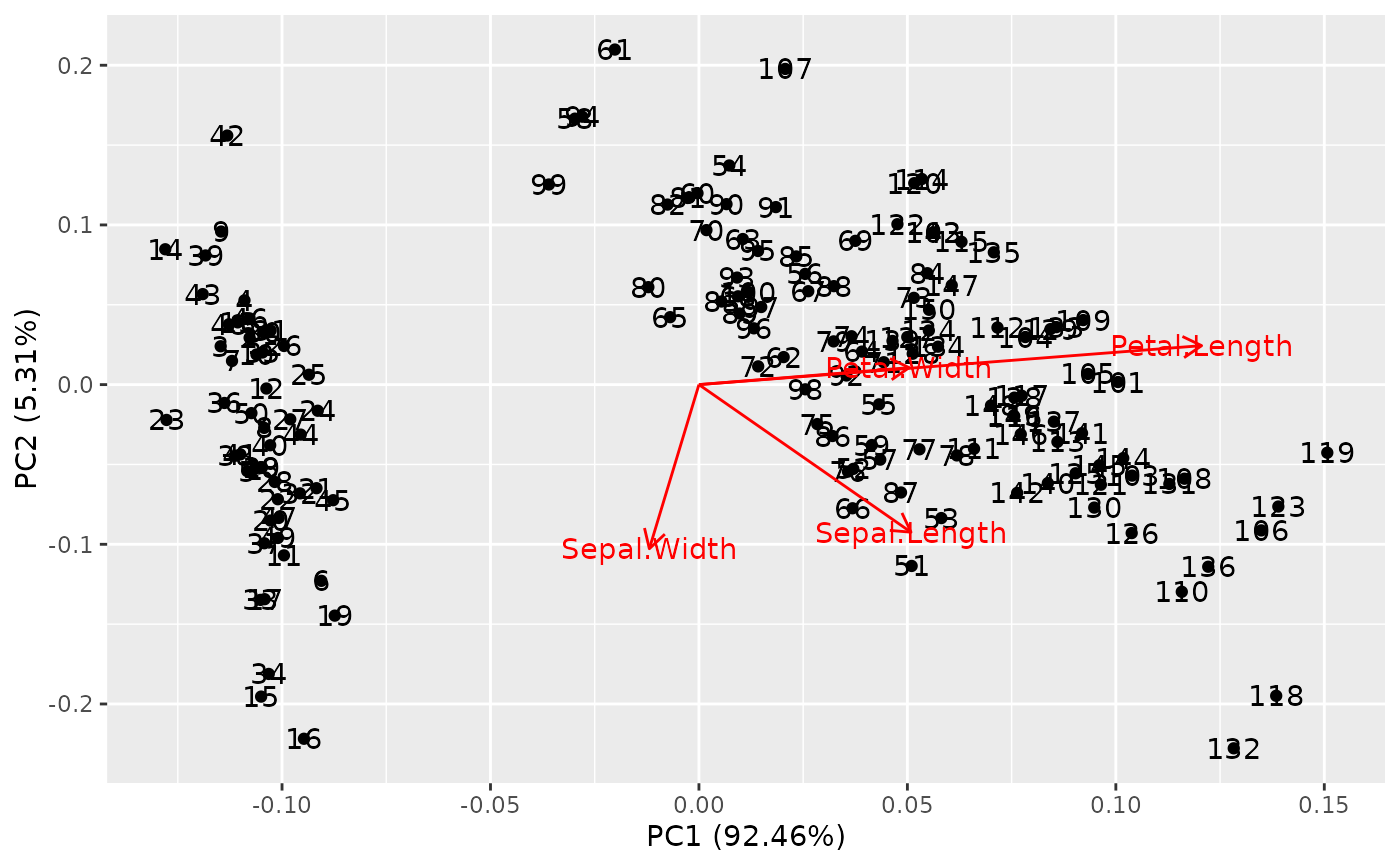
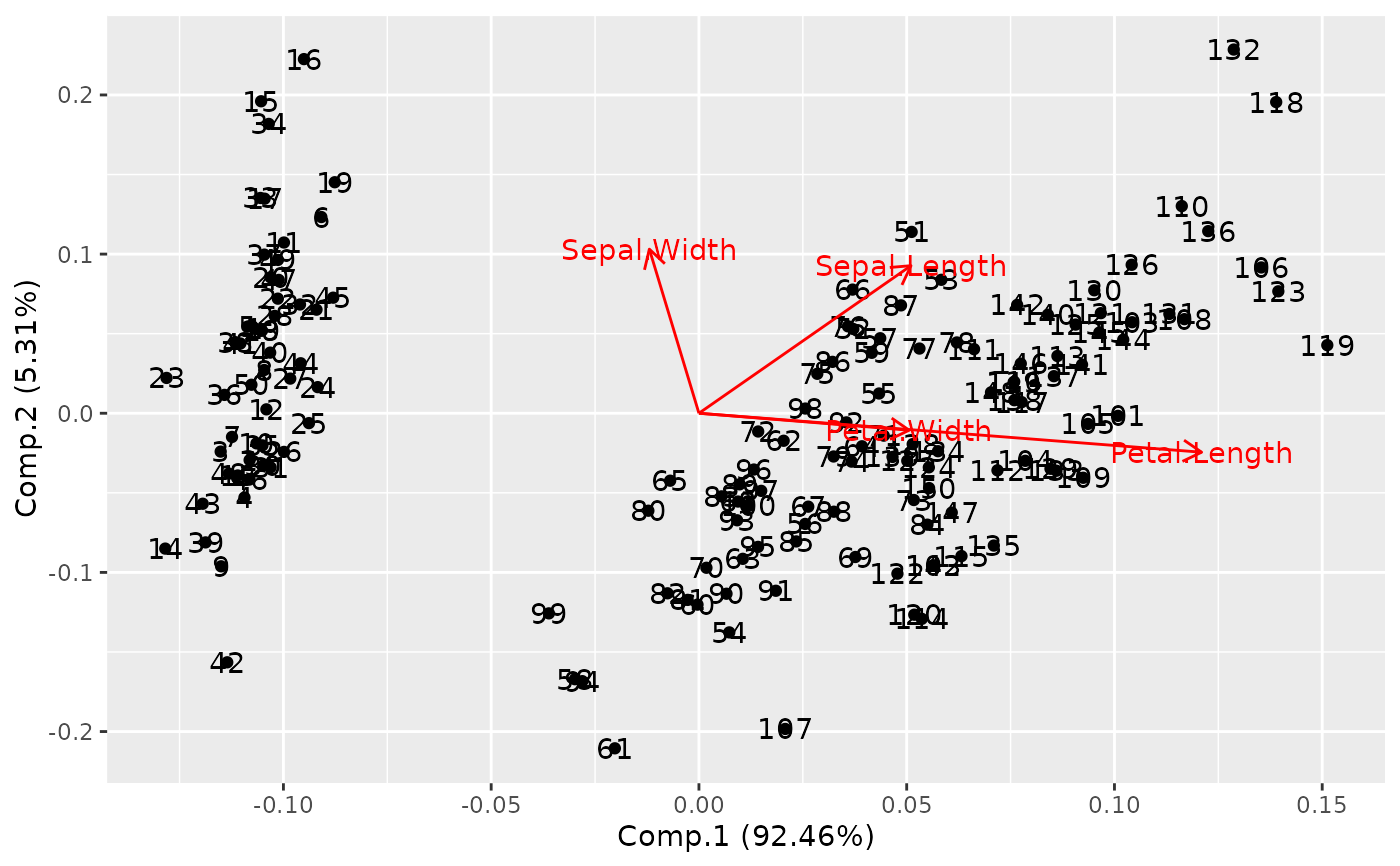
 autoplot(stats::prcomp(iris[-5]), label = TRUE, loadings = TRUE, loadings.label = TRUE)
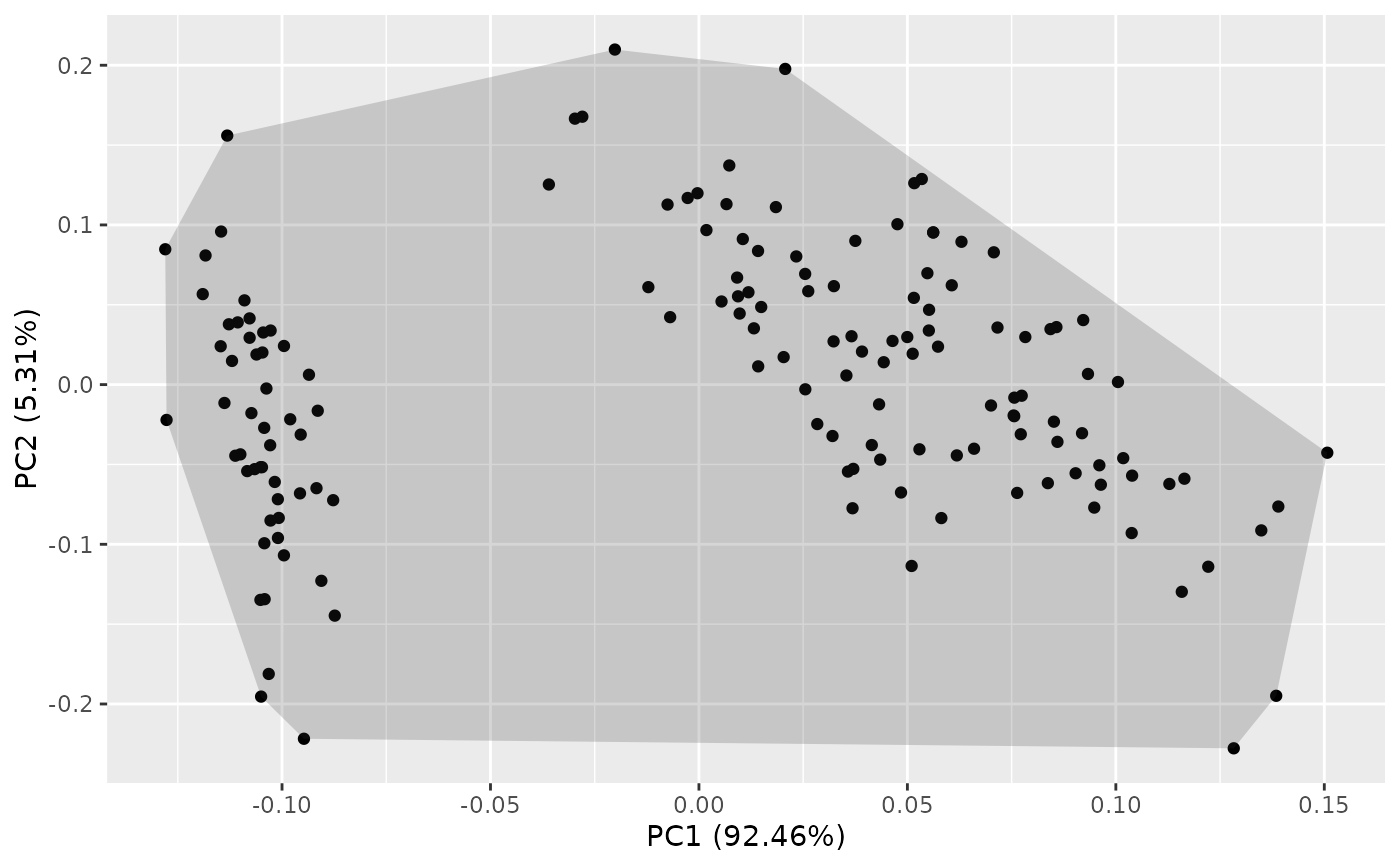
 autoplot(stats::prcomp(iris[-5]), frame = TRUE)
 autoplot(stats::prcomp(iris[-5]), data = iris, frame = TRUE,
frame.colour = 'Species')
autoplot(stats::prcomp(iris[-5]), data = iris, frame = TRUE,
frame.colour = 'Species')
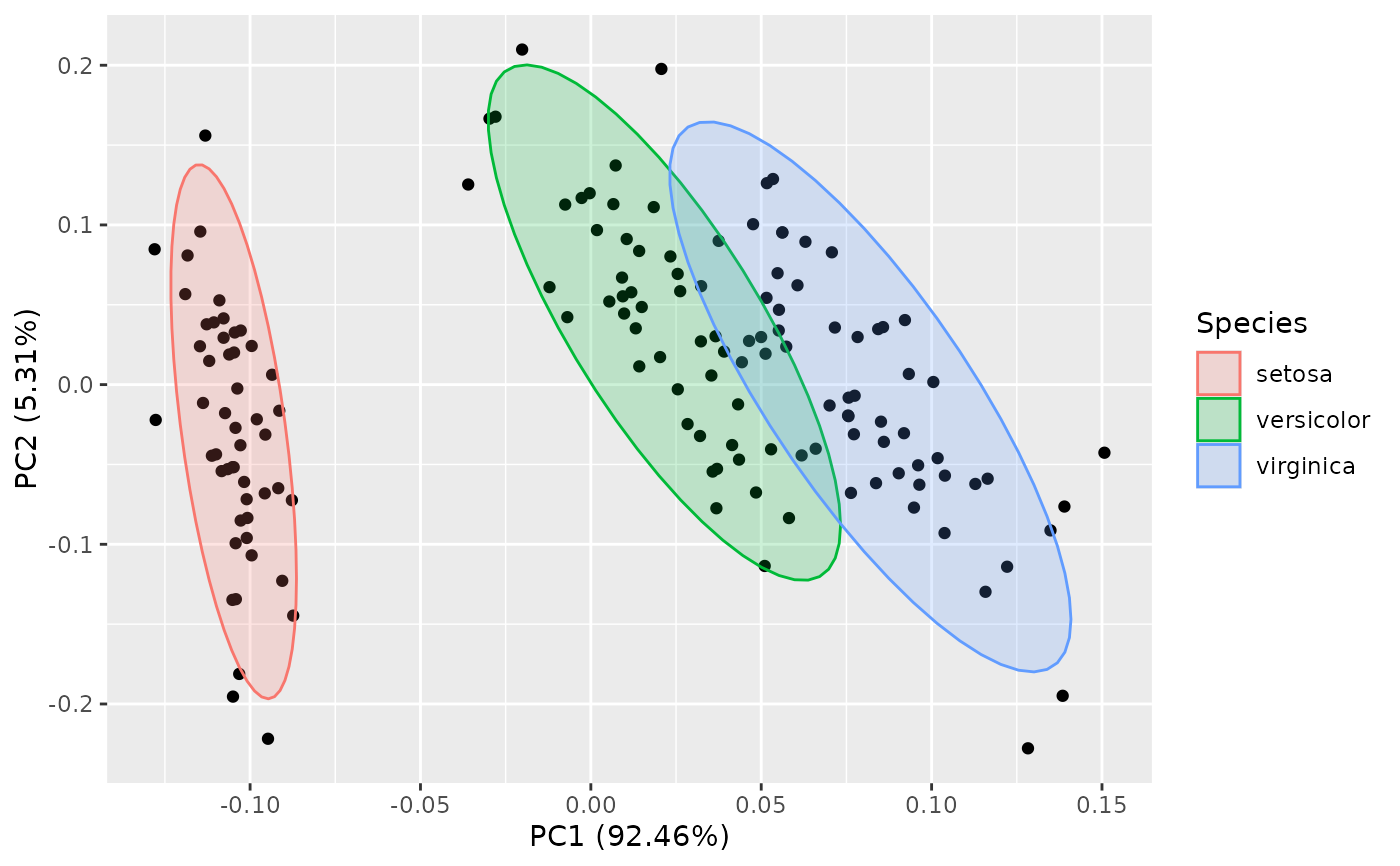
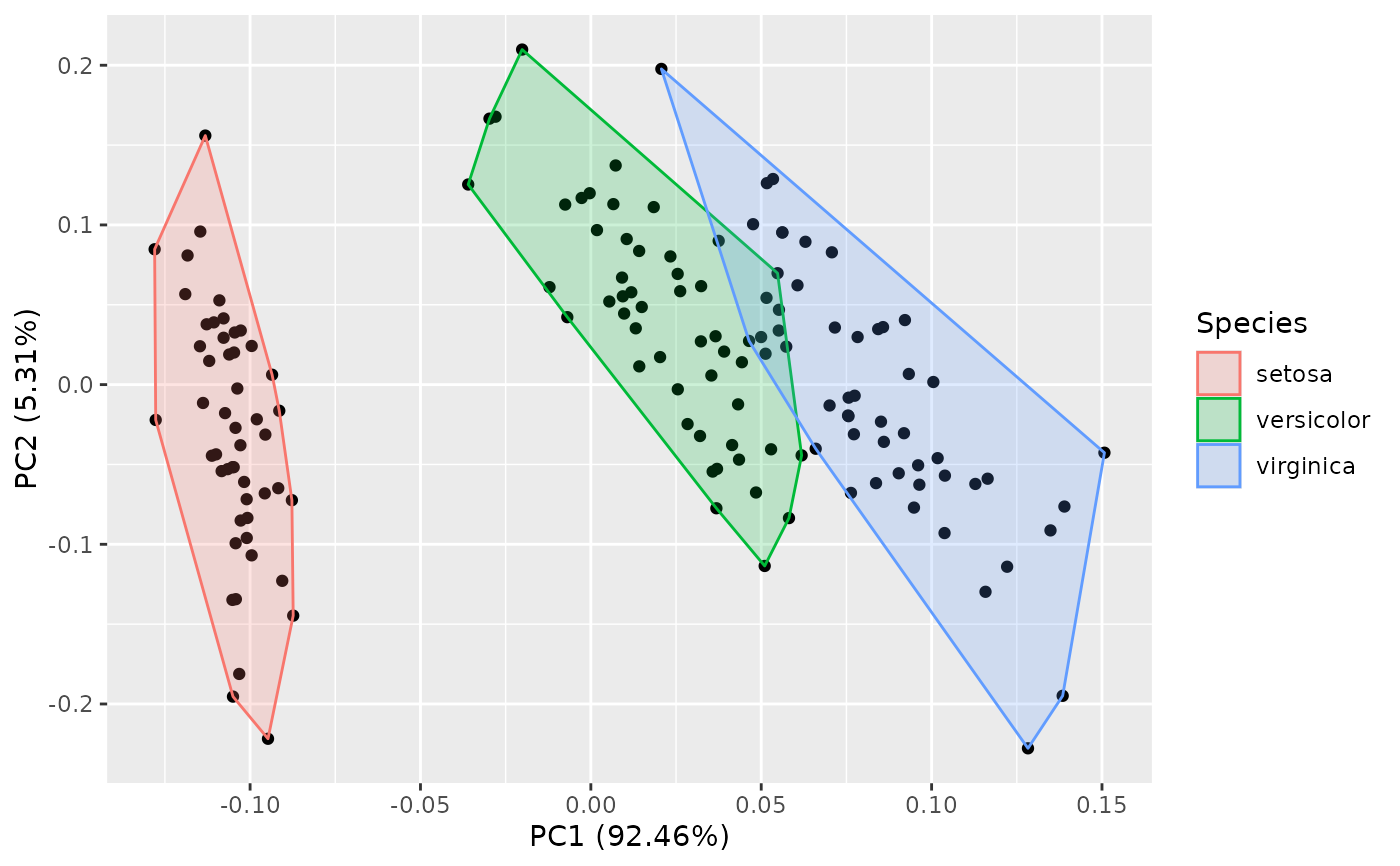 autoplot(stats::prcomp(iris[-5]), data = iris, frame = TRUE,
frame.type = 't', frame.colour = 'Species')
autoplot(stats::prcomp(iris[-5]), data = iris, frame = TRUE,
frame.type = 't', frame.colour = 'Species')
 autoplot(stats::princomp(iris[-5]))
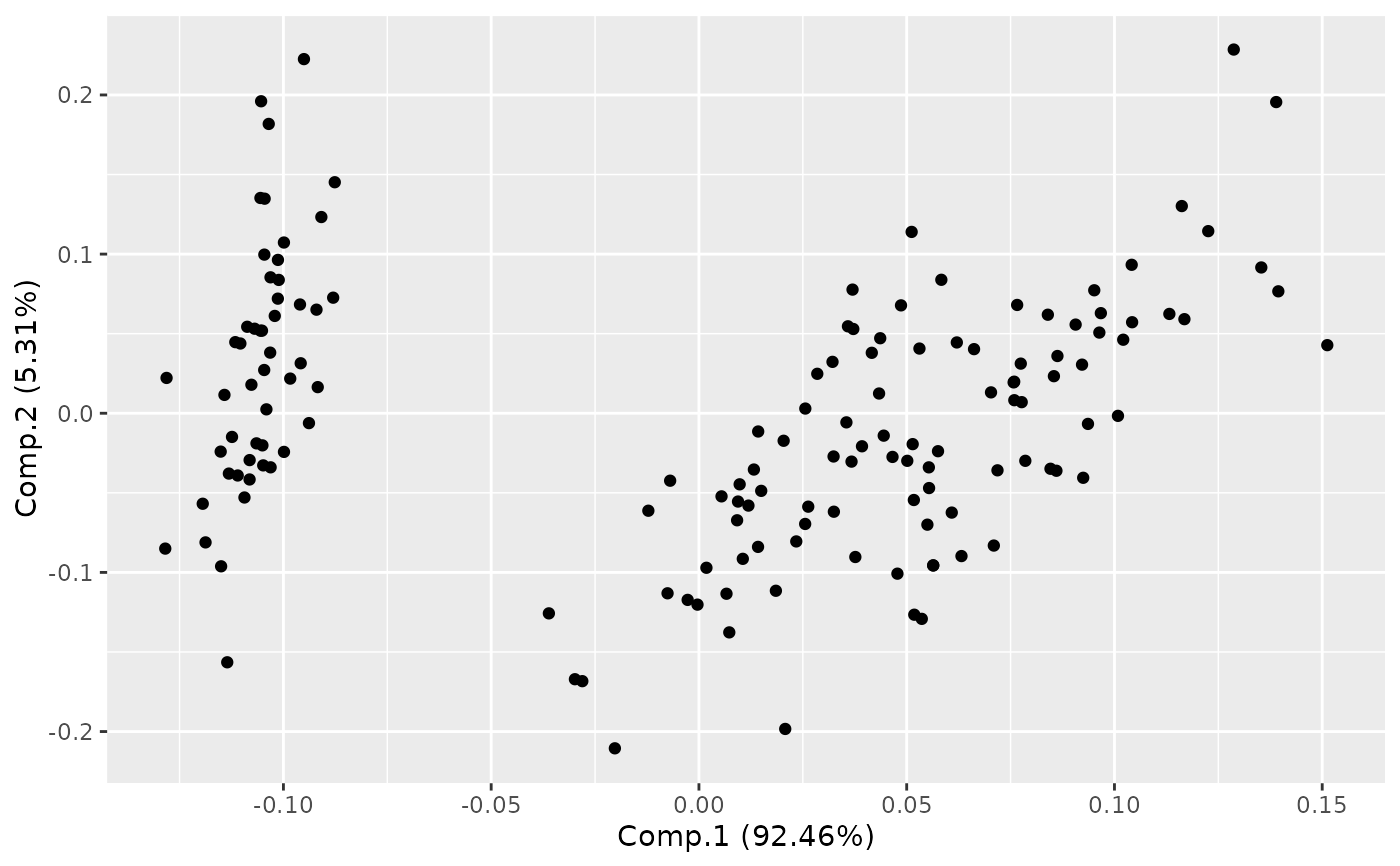 autoplot(stats::princomp(iris[-5]), data = iris)
 autoplot(stats::princomp(iris[-5]), data = iris, colour = 'Species')
 autoplot(stats::princomp(iris[-5]), label = TRUE, loadings = TRUE, loadings.label = TRUE)
 #Plot PC 2 and 3
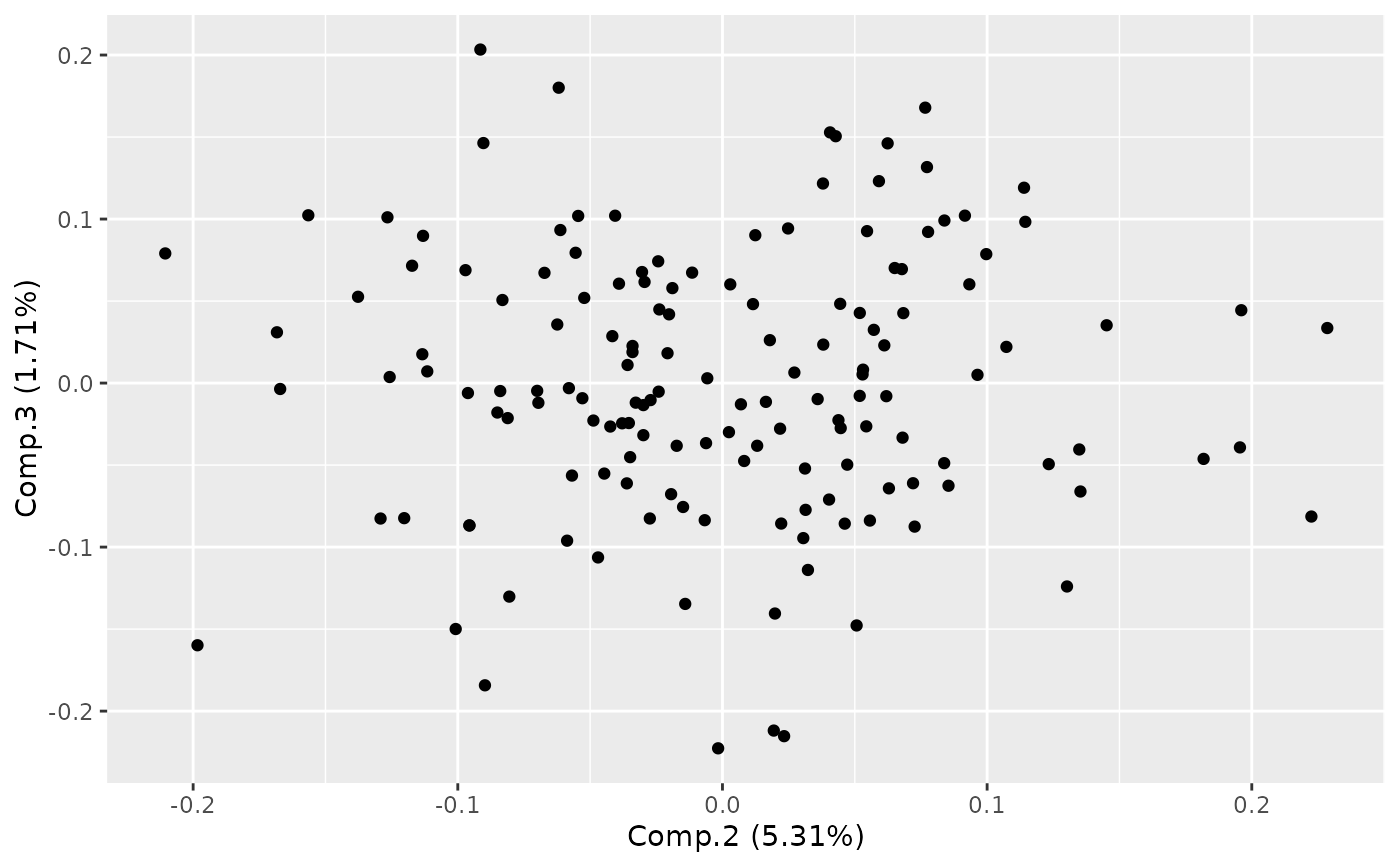
autoplot(stats::princomp(iris[-5]), x = 2, y = 3)
#Plot PC 2 and 3
autoplot(stats::princomp(iris[-5]), x = 2, y = 3)
 #Don't show the variance explained
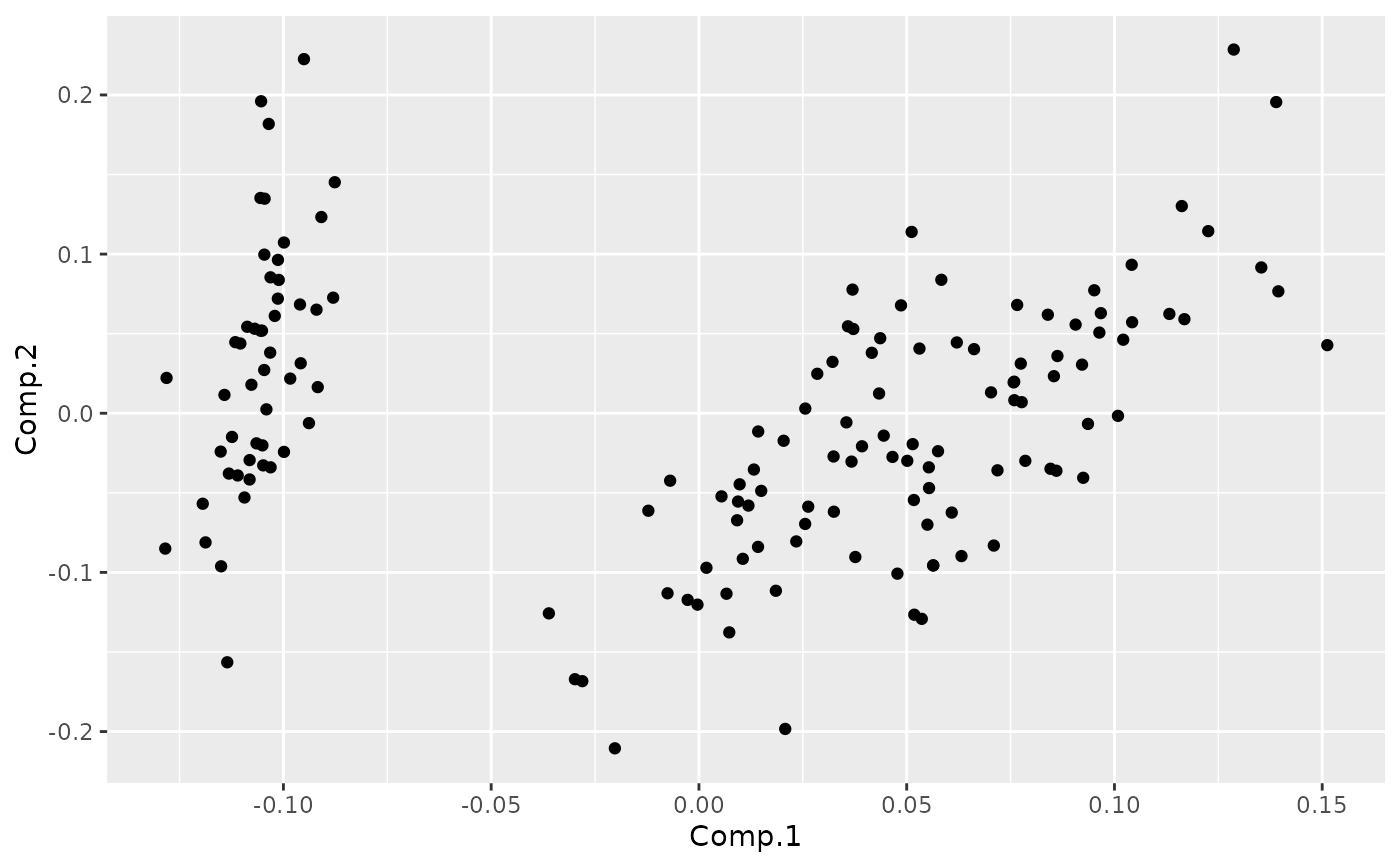
autoplot(stats::princomp(iris[-5]), variance_percentage = FALSE)
#Don't show the variance explained
autoplot(stats::princomp(iris[-5]), variance_percentage = FALSE)
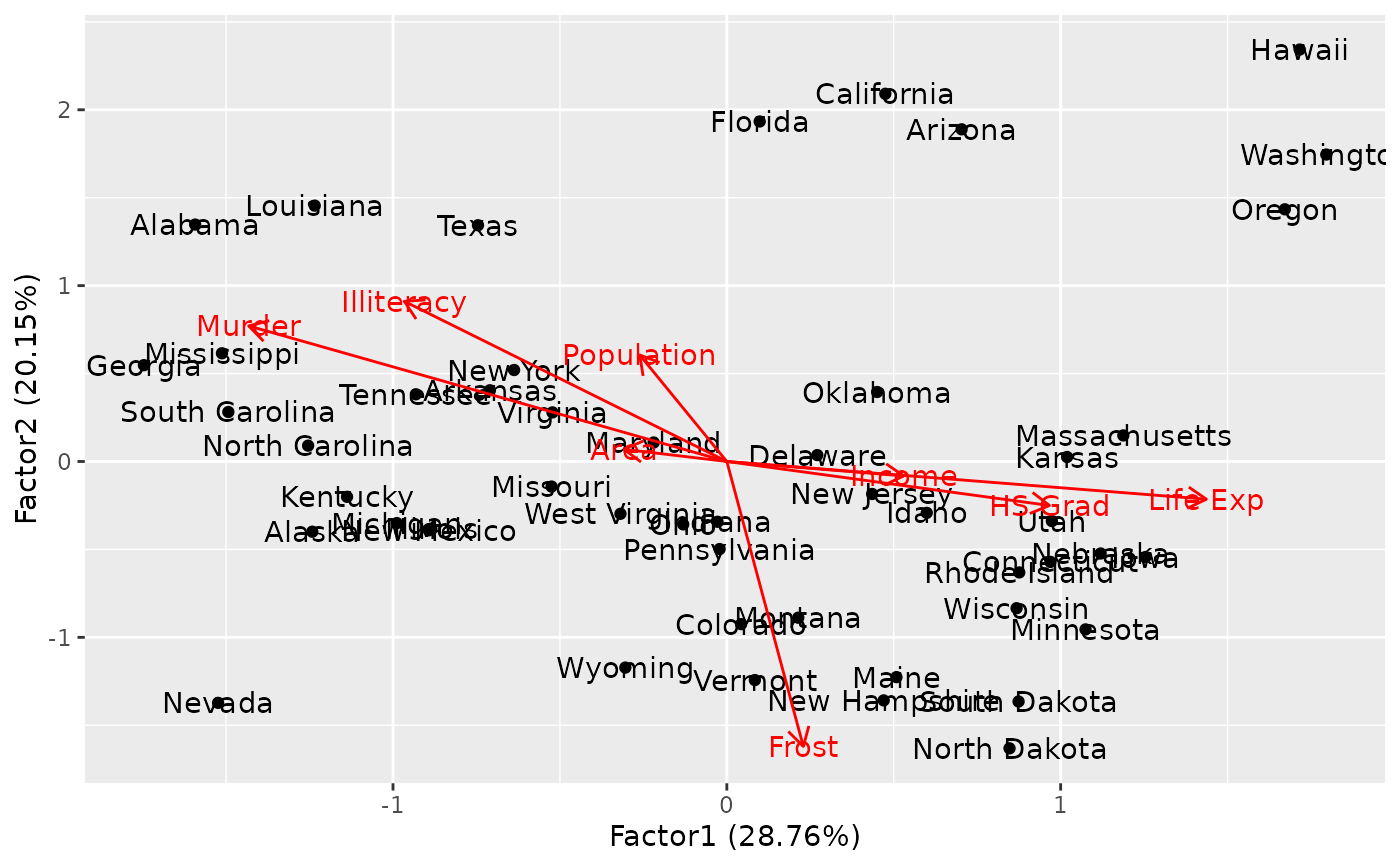
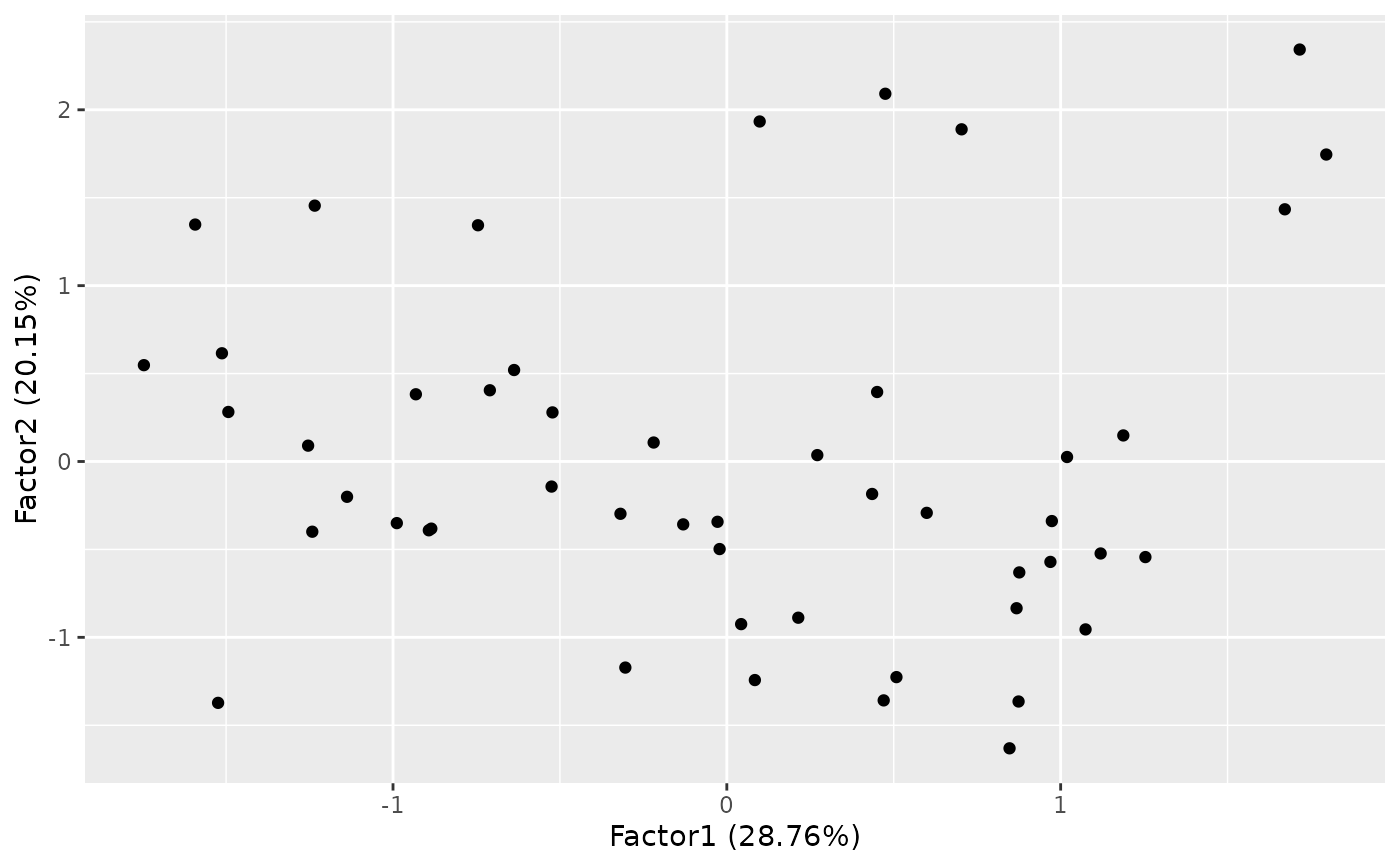
 d.factanal <- stats::factanal(state.x77, factors = 3, scores = 'regression')
autoplot(d.factanal)
d.factanal <- stats::factanal(state.x77, factors = 3, scores = 'regression')
autoplot(d.factanal)
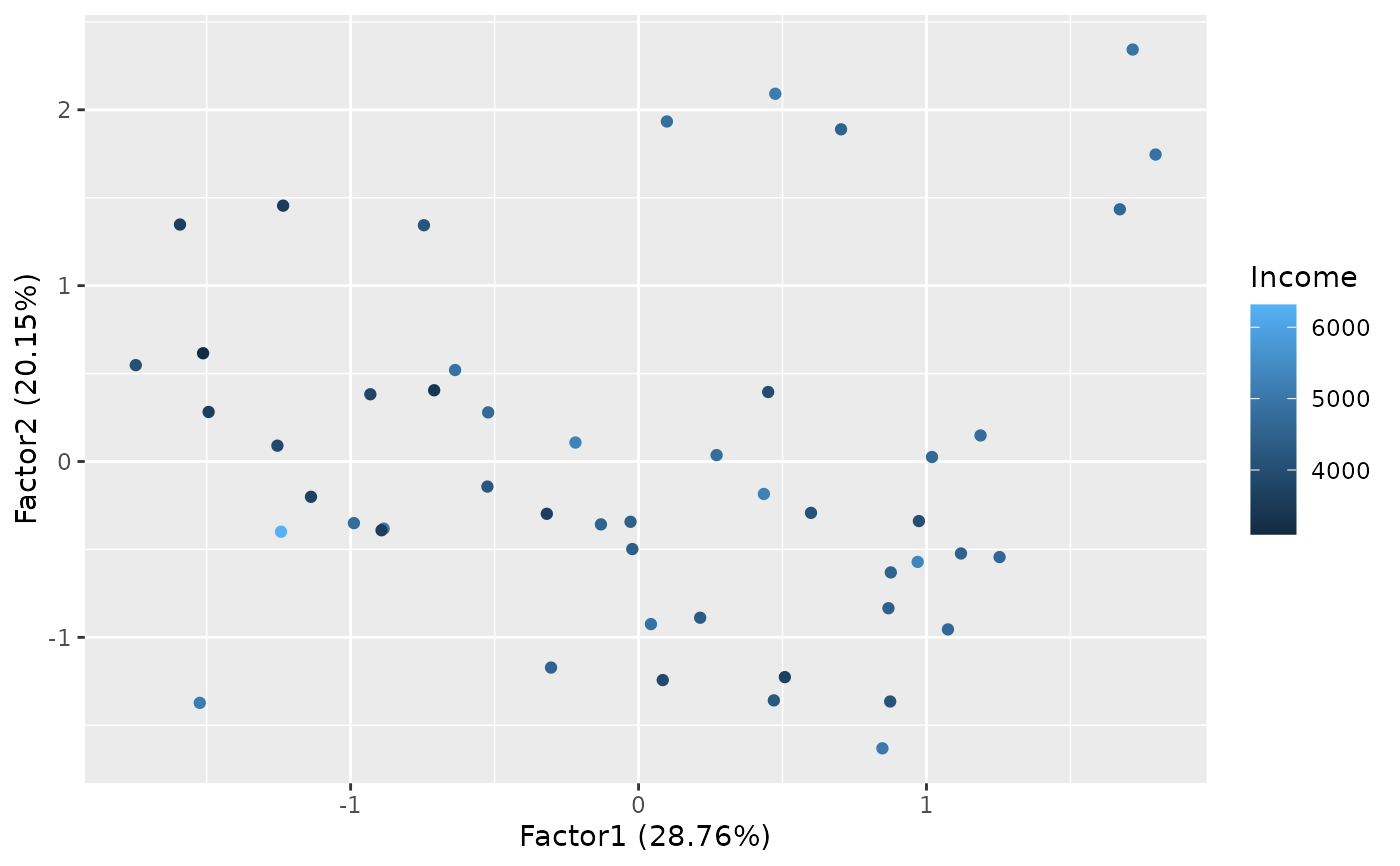
 autoplot(d.factanal, data = state.x77, colour = 'Income')
 autoplot(d.factanal, label = TRUE, loadings = TRUE, loadings.label = TRUE)