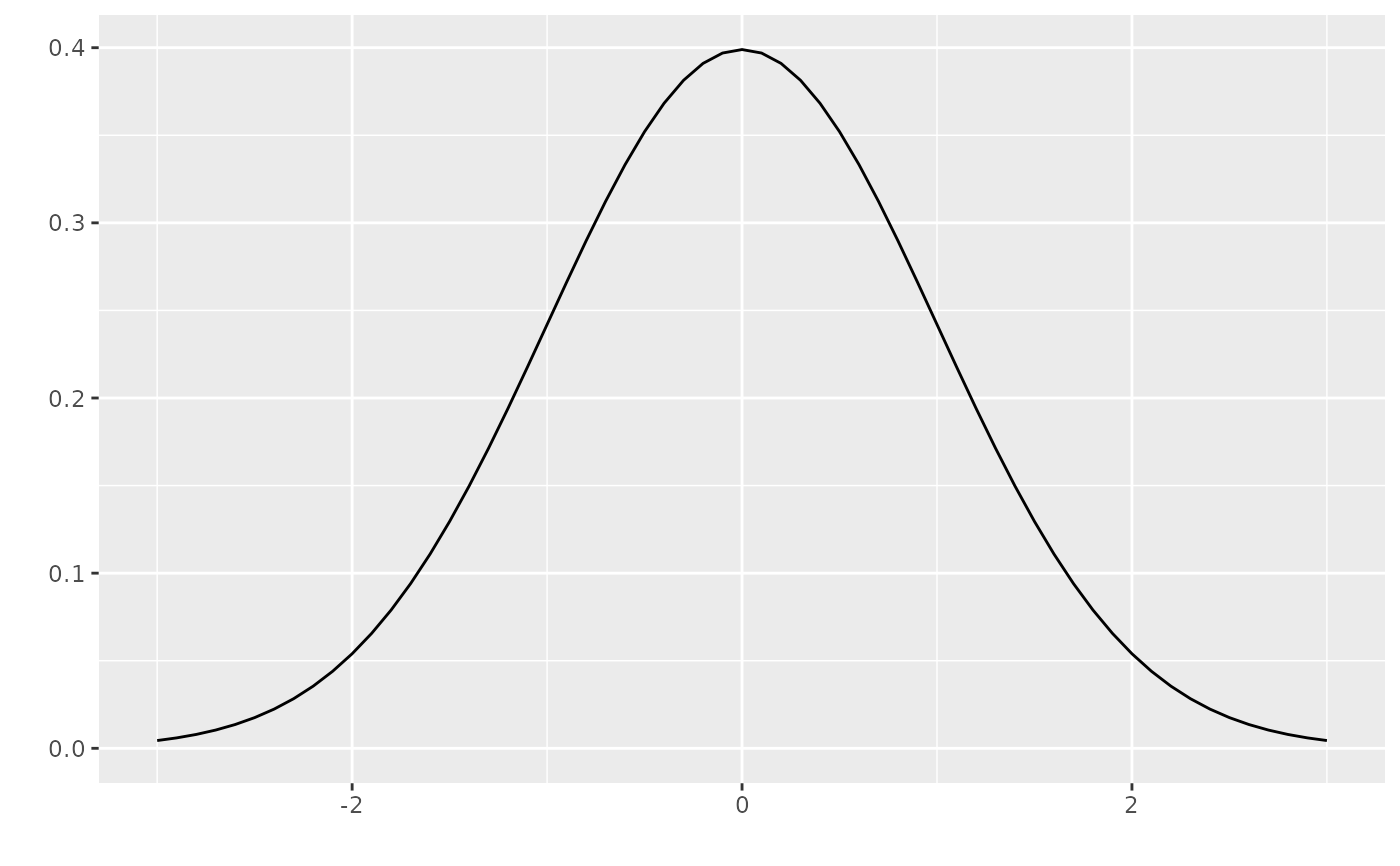
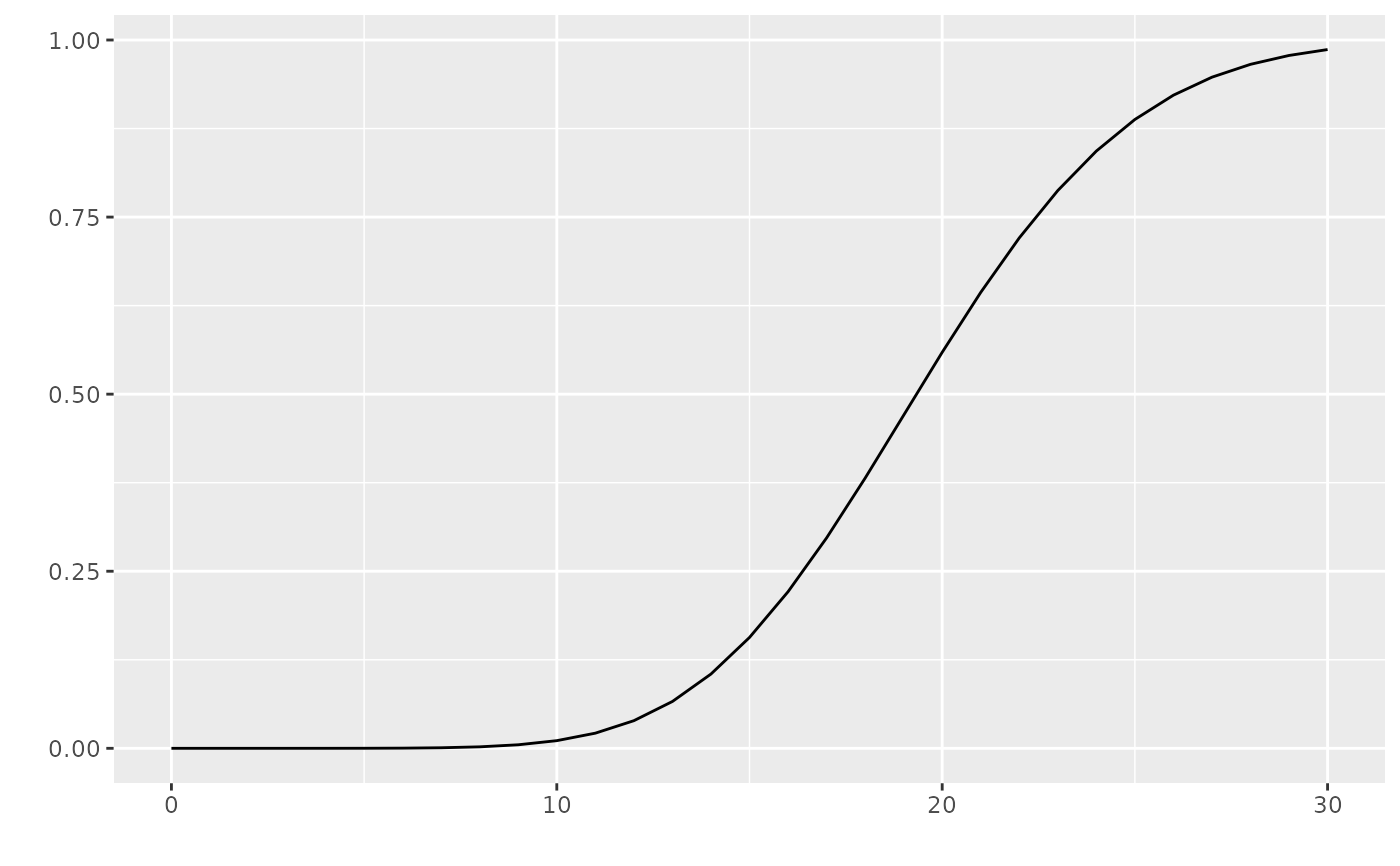
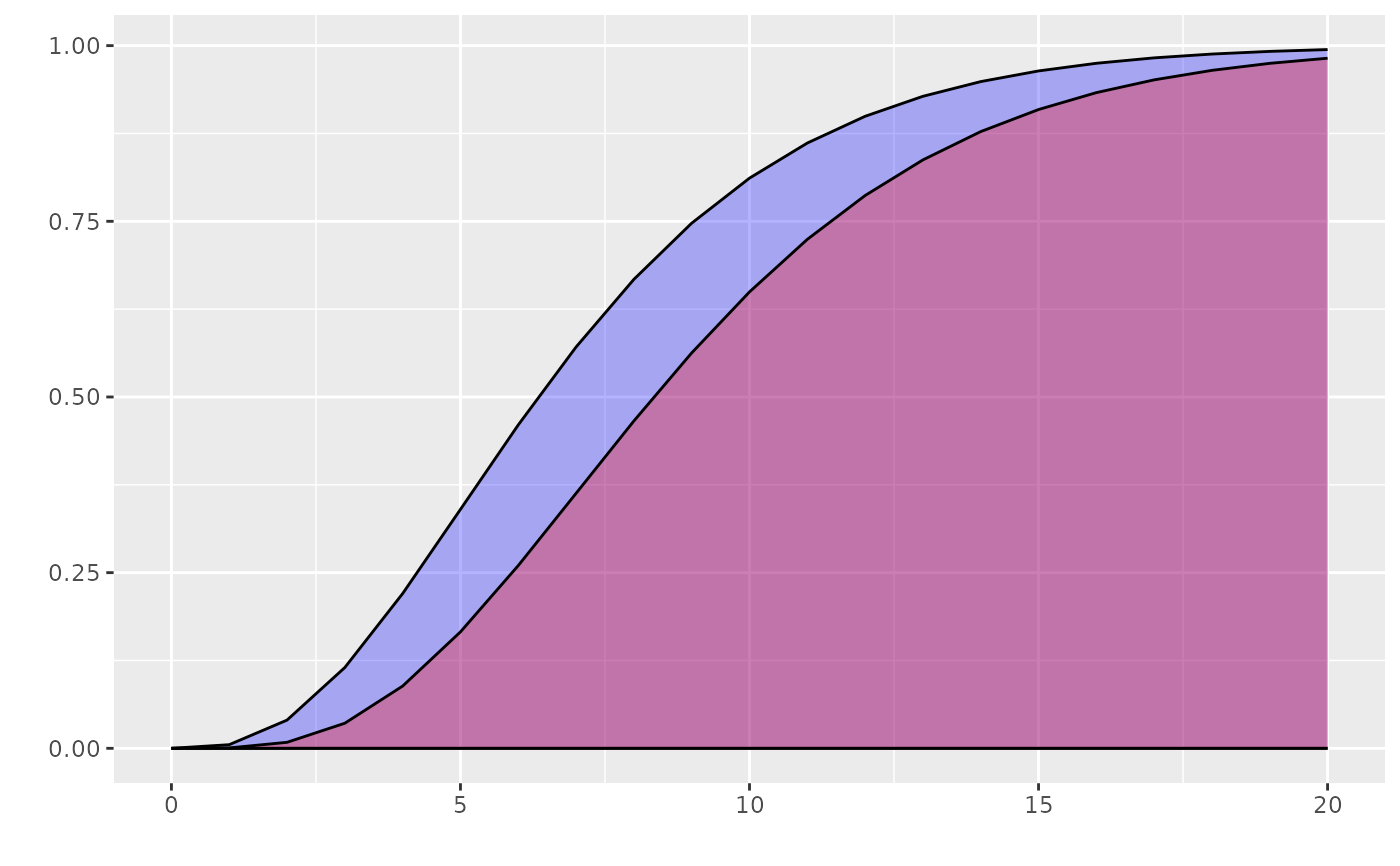
R/fortify_stats_density.R
ggdistribution.Rd
Plot distribution
ggdistribution( func, x, p = NULL, colour = "#000000", linetype = NULL, fill = NULL, alpha = NULL, xlim = c(NA, NA), ylim = c(NA, NA), log = "", main = NULL, xlab = NULL, ylab = NULL, asp = NULL, ... )
PDF or CDF function
Numeric vector to be passed to func
ggplot2::ggplot instance to plot
ggplot2::ggplot
Line colour
Line type
Fill colour
Alpha
X axis limit
Y axis limit
log
main
xlab
ylab
asp
Keywords passed to PDC/CDF func
ggplot
ggdistribution(dnorm, seq(-3, 3, 0.1), mean = 0, sd = 1) ggdistribution(ppois, seq(0, 30), lambda = 20) p <- ggdistribution(pchisq, 0:20, df = 7, fill = 'blue') ggdistribution(pchisq, 0:20, p = p, df = 9, fill = 'red')