Add p-values manually to a ggplot, such as box plots, dot plots and stripcharts. Frequently asked questions are available on Datanovia ggpubr FAQ page, for example:
Usage
stat_pvalue_manual(
  data,
  label = NULL,
  y.position = "y.position",
  xmin = "group1",
  xmax = "group2",
  x = NULL,
  size = 3.88,
  label.size = size,
  p.digits = 3,
  p.format.style = "default",
  p.leading.zero = NULL,
  p.min.threshold = NULL,
  p.decimal.mark = NULL,
  bracket.size = 0.3,
  bracket.nudge.y = 0,
  bracket.shorten = 0,
  color = "black",
  linetype = 1,
  tip.length = 0.03,
  tip.length.ref = c("data", "axis"),
  remove.bracket = FALSE,
  step.increase = 0,
  step.group.by = NULL,
  hide.ns = FALSE,
  vjust = 0,
  coord.flip = FALSE,
  position = "identity",
  inherit.aes = FALSE,
  ...
)
Arguments
- data
a data frame containing statistical test results. The expected default format should contain the following columns:
group1 | group2 | p | y.position | etc.group1andgroup2are the groups that have been compared.pis the resulting p-value.y.positionis the y coordinates of the p-values in the plot.- label
the column containing the label (e.g.: label = "p" or label = "p.adj"), where
pis the p-value. Can be also an expression that can be formatted by theglue()package. For example, when specifying label = "t-test, p = {p}", the expression {p} will be replaced by its value. Values inserted through a glue expression are taken from the raw data column and are not rounded byp.digits; to round within a glue expression, wrap the value, e.g.label = "p = \{signif(p, 3)\}"(or{format_p_value(p)}for the p-value house style).- y.position
column containing the coordinates (in data units) to be used for absolute positioning of the label. Default value is "y.position". Can be also a numeric vector.
- xmin
column containing the position of the left sides of the brackets. Default value is "group1".
- xmax
(optional) column containing the position of the right sides of the brackets. Default value is "group2". If NULL, the p-values are plotted as a simple text.
- x
x position of the p-value. Should be used only when you want plot the p-value as text (without brackets).
- size, label.size
size of label text.
- p.digits
integer indicating the number of digits used to format recognized numeric p-value label columns (
labelis one of"p","p.adj","p.value","p.val","pval","padj"). Default is 3. Set toNULLto print the raw value without rounding (this also disablesp.format.styleand the related formatting arguments). All other labels are left unchanged: other numeric columns (e.g."statistic","n", effect sizes), significance symbols ("p.signif","p.adj.signif"), already-formatted strings, andglueexpressions. A p-named column whose values fall outside[0, 1]is also left as-is. Uses the same formatting engine (format_p_value()) asstat_anova_test()for consistency across layers. The style of this formatting is further controlled byp.format.style,p.leading.zero,p.min.thresholdandp.decimal.mark(same arguments asstat_compare_means()).- p.format.style
character string specifying the p-value formatting style applied to recognized numeric p-value label columns (see
p.digits). One of:"default"(backward compatible, uses scientific notation),"apa"(APA style, no leading zero),"nejm"(NEJM style),"lancet"(Lancet style),"ama"(AMA style),"graphpad"(GraphPad style), or"scientific"(scientific notation for GWAS). Seelist_p_format_stylesfor details. Default is"default", which leaves the rendered p-value labels unchanged.- p.leading.zero
logical indicating whether to include the leading zero before the decimal point (e.g., "0.05" vs ".05"). If provided, overrides the style default.
- p.min.threshold
numeric specifying the minimum p-value to display exactly. Values below this threshold are shown as "< threshold" (e.g.
p.min.threshold = 0.001renders very small p-values as "< 0.001"). If provided, overrides the style default.- p.decimal.mark
character string to use as the decimal mark. If
NULL, usesgetOption("OutDec").- bracket.size
Width of the lines of the bracket.
- bracket.nudge.y
Vertical adjustment to nudge brackets by. Useful to move up or move down the bracket. If positive value, brackets will be moved up; if negative value, brackets are moved down.
- bracket.shorten
a small numeric value in [0-1] for shortening the with of bracket.
- color
text and line color. Can be variable name in the data for coloring by groups.
- linetype
linetype. Can be variable name in the data for changing linetype by groups.
- tip.length
numeric vector with the fraction that the bracket tips go down to indicate the precise column. Interpreted relative to the reference set by
tip.length.ref. Default is 0.03.- tip.length.ref
character string specifying what
tip.lengthis a fraction of. Either"data"(default): fraction of the trained data range (tips scale with the data; existing plots unchanged); or"axis": fraction of the y-axis range (ylim/scale_y_*), giving visually constant tip lengths across plots with different scales (#362).- remove.bracket
logical, if
TRUE, brackets are removed from the plot. Considered only in the situation, where comparisons are performed against reference group or against "all".- step.increase
numeric vector with the increase in fraction of total height for every additional comparison to minimize overlap.
- step.group.by
a variable name for grouping brackets before adding step.increase. Useful to group bracket by facet panel.
- hide.ns
can be logical value or a character vector.
Case when logical value. If TRUE, hide ns symbol when displaying significance levels. Filter is done by checking the column
p.adj.signif,p.signif,p.adjandp.Case when character value. Possible values are "p" or "p.adj", for filtering out non significant.
- vjust
move the text up or down relative to the bracket. Can be also a column name available in the data.
- coord.flip
logical. If
TRUE, flip x and y coordinates so that horizontal becomes vertical, and vertical, horizontal. When adding the p-values to a horizontal ggplot (generated usingcoord_flip()), you need to specify the optioncoord.flip = TRUE.- position
position adjustment, either as a string, or the result of a call to a position adjustment function.
- inherit.aes
If
FALSE(the default), overrides the default aesthetics, rather than combining with them. This is most useful for helper functions that define both data and aesthetics and shouldn't inherit behaviour from the default plot specification, e.g.stat_pvalue_manual(). Most layers should useTRUE(the ggplot2 default), butstat_pvalue_manual()uses its own data with different column names than the parent plot data, soFALSEavoids conflicts between parent plot aesthetics (likefillorcolor) and the p-value annotation data.- ...
other arguments passed to the function
geom_bracket()orgeom_text()
Examples
# T-test
stat.test <- compare_means(
len ~ dose,
data = ToothGrowth,
method = "t.test"
)
stat.test
#> # A tibble: 3 × 9
#> .y. group1 group2 p p.adj p.format p.signif method p.format.signif
#> <chr> <chr> <chr> <dbl> <dbl> <chr> <chr> <chr> <chr>
#> 1 len 0.5 1 1.27e- 7 2.5e- 7 1.3e-07 **** T-test p = 1.3e-07 ****
#> 2 len 0.5 2 4.40e-14 1.3e-13 4.4e-14 **** T-test p = 4.4e-14 ****
#> 3 len 1 2 1.91e- 5 1.9e- 5 1.9e-05 **** T-test p = 1.9e-05 ****
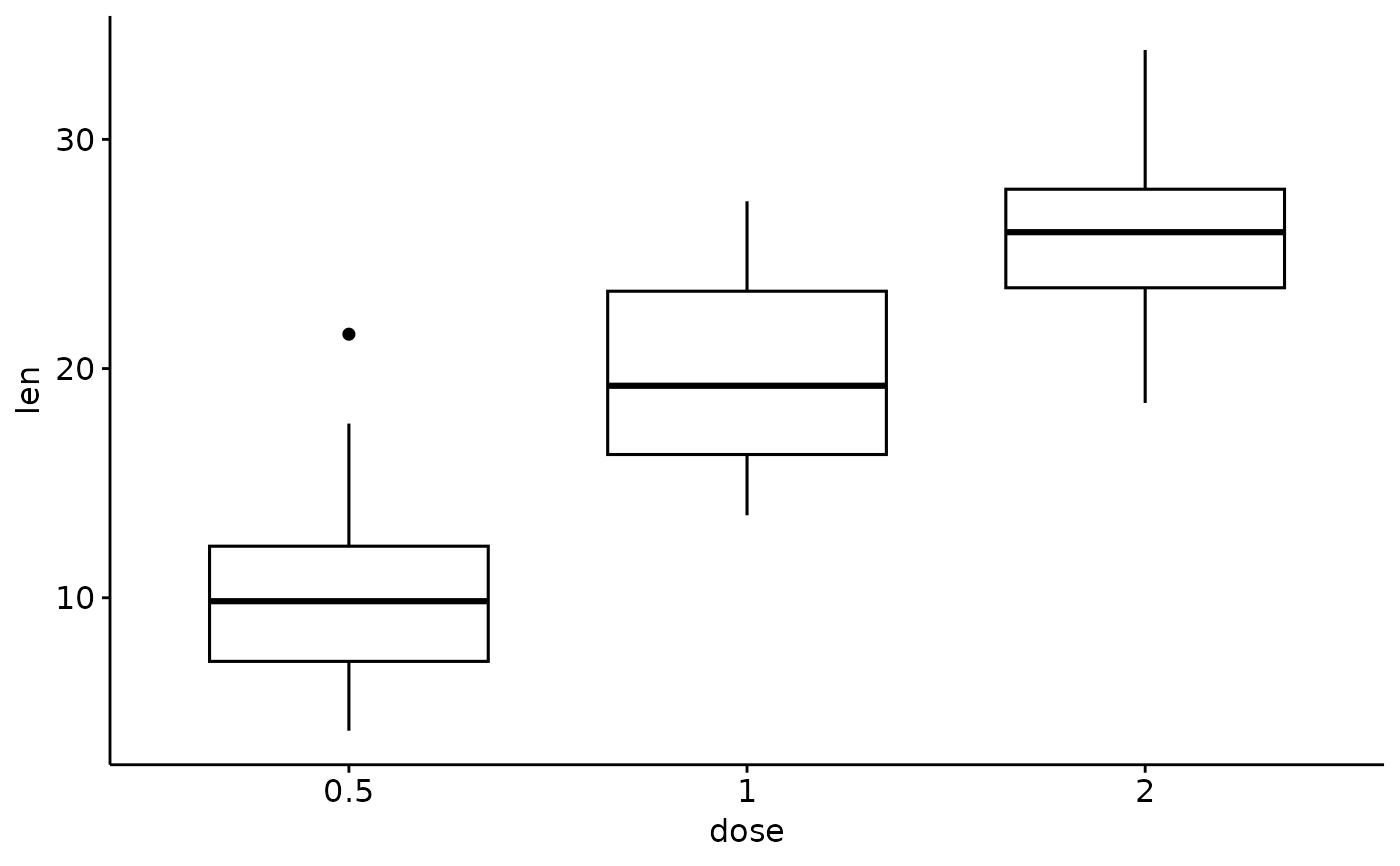
# Create a simple box plot
p <- ggboxplot(ToothGrowth, x = "dose", y = "len")
p
 # Perform a t-test between groups
stat.test <- compare_means(
len ~ dose,
data = ToothGrowth,
method = "t.test"
)
stat.test
#> # A tibble: 3 × 9
#> .y. group1 group2 p p.adj p.format p.signif method p.format.signif
#> <chr> <chr> <chr> <dbl> <dbl> <chr> <chr> <chr> <chr>
#> 1 len 0.5 1 1.27e- 7 2.5e- 7 1.3e-07 **** T-test p = 1.3e-07 ****
#> 2 len 0.5 2 4.40e-14 1.3e-13 4.4e-14 **** T-test p = 4.4e-14 ****
#> 3 len 1 2 1.91e- 5 1.9e- 5 1.9e-05 **** T-test p = 1.9e-05 ****
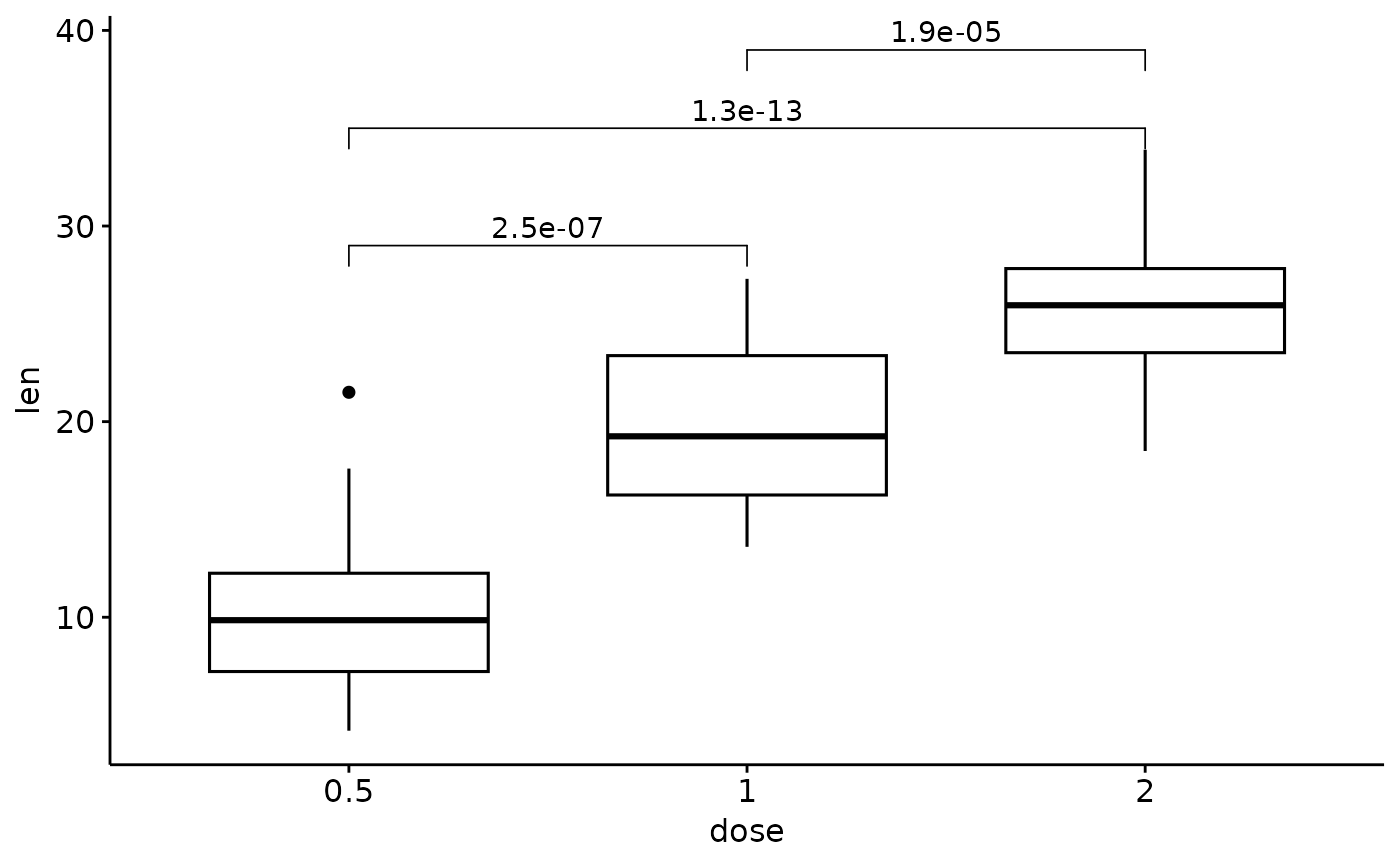
# Add p-values manually from stat.test data
# First specify the y.position of each comparison
stat.test <- stat.test %>%
mutate(y.position = c(29, 35, 39))
p + stat_pvalue_manual(stat.test, label = "p.adj")
# Perform a t-test between groups
stat.test <- compare_means(
len ~ dose,
data = ToothGrowth,
method = "t.test"
)
stat.test
#> # A tibble: 3 × 9
#> .y. group1 group2 p p.adj p.format p.signif method p.format.signif
#> <chr> <chr> <chr> <dbl> <dbl> <chr> <chr> <chr> <chr>
#> 1 len 0.5 1 1.27e- 7 2.5e- 7 1.3e-07 **** T-test p = 1.3e-07 ****
#> 2 len 0.5 2 4.40e-14 1.3e-13 4.4e-14 **** T-test p = 4.4e-14 ****
#> 3 len 1 2 1.91e- 5 1.9e- 5 1.9e-05 **** T-test p = 1.9e-05 ****
# Add p-values manually from stat.test data
# First specify the y.position of each comparison
stat.test <- stat.test %>%
mutate(y.position = c(29, 35, 39))
p + stat_pvalue_manual(stat.test, label = "p.adj")
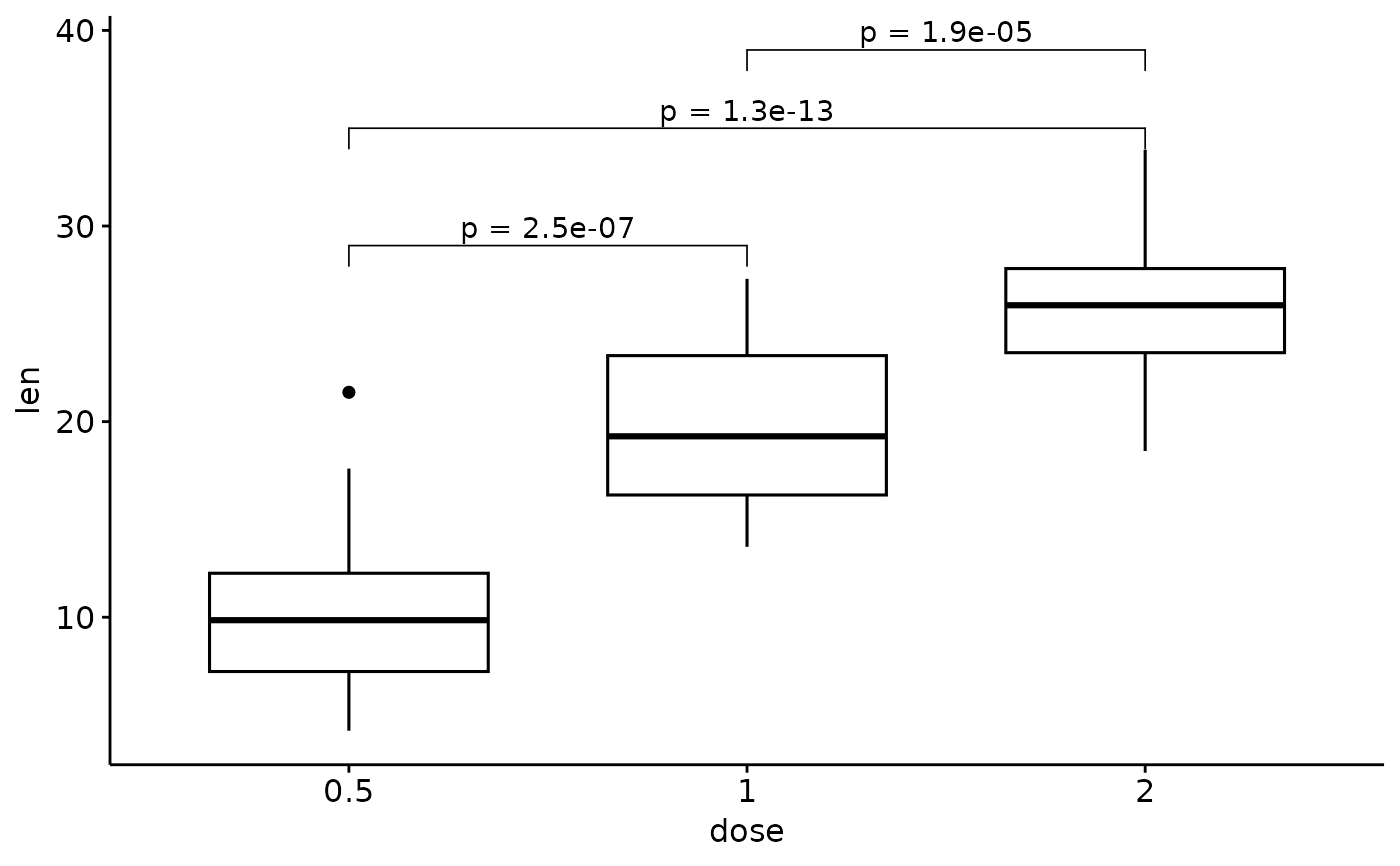
 # Customize the label with glue expression
# (https://github.com/tidyverse/glue)
p + stat_pvalue_manual(stat.test, label = "p = {p.adj}")
# Customize the label with glue expression
# (https://github.com/tidyverse/glue)
p + stat_pvalue_manual(stat.test, label = "p = {p.adj}")
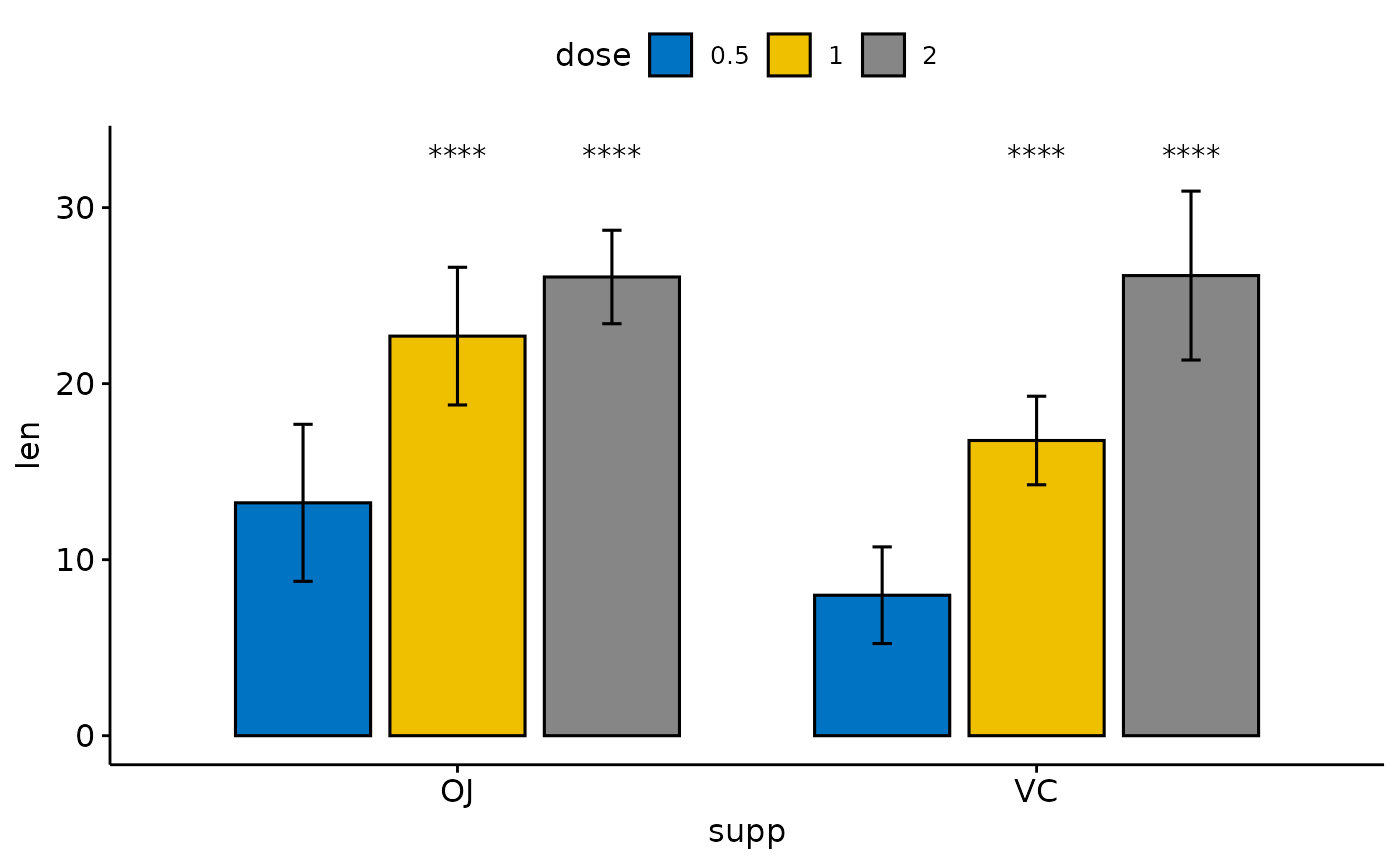
 # Grouped bar plots
# %%%%%%%%%%%%%%%%%%%%%%%%%%%%%%%%%%%%%%%%%%%
ToothGrowth$dose <- as.factor(ToothGrowth$dose)
# Comparisons against reference
stat.test <- compare_means(
len ~ dose,
data = ToothGrowth, group.by = "supp",
method = "t.test", ref.group = "0.5"
)
stat.test
#> # A tibble: 4 × 10
#> supp .y. group1 group2 p p.adj p.format p.signif method
#> <fct> <chr> <chr> <chr> <dbl> <dbl> <chr> <chr> <chr>
#> 1 VC len 0.5 1 0.000000681 0.00000068 6.8e-07 **** T-test
#> 2 VC len 0.5 2 0.0000000468 0.000000094 4.7e-08 **** T-test
#> 3 OJ len 0.5 1 0.0000878 0.000088 8.8e-05 **** T-test
#> 4 OJ len 0.5 2 0.00000132 0.0000026 1.3e-06 **** T-test
#> # ℹ 1 more variable: p.format.signif <chr>
# Plot
bp <- ggbarplot(ToothGrowth,
x = "supp", y = "len",
fill = "dose", palette = "jco",
add = "mean_sd", add.params = list(group = "dose"),
position = position_dodge(0.8)
)
bp + stat_pvalue_manual(
stat.test,
x = "supp", y.position = 33,
label = "p.signif",
position = position_dodge(0.8)
)
# Grouped bar plots
# %%%%%%%%%%%%%%%%%%%%%%%%%%%%%%%%%%%%%%%%%%%
ToothGrowth$dose <- as.factor(ToothGrowth$dose)
# Comparisons against reference
stat.test <- compare_means(
len ~ dose,
data = ToothGrowth, group.by = "supp",
method = "t.test", ref.group = "0.5"
)
stat.test
#> # A tibble: 4 × 10
#> supp .y. group1 group2 p p.adj p.format p.signif method
#> <fct> <chr> <chr> <chr> <dbl> <dbl> <chr> <chr> <chr>
#> 1 VC len 0.5 1 0.000000681 0.00000068 6.8e-07 **** T-test
#> 2 VC len 0.5 2 0.0000000468 0.000000094 4.7e-08 **** T-test
#> 3 OJ len 0.5 1 0.0000878 0.000088 8.8e-05 **** T-test
#> 4 OJ len 0.5 2 0.00000132 0.0000026 1.3e-06 **** T-test
#> # ℹ 1 more variable: p.format.signif <chr>
# Plot
bp <- ggbarplot(ToothGrowth,
x = "supp", y = "len",
fill = "dose", palette = "jco",
add = "mean_sd", add.params = list(group = "dose"),
position = position_dodge(0.8)
)
bp + stat_pvalue_manual(
stat.test,
x = "supp", y.position = 33,
label = "p.signif",
position = position_dodge(0.8)
)