grid.pattern_wave() draws a wave pattern onto the graphic device.
names_wave is a character vector of supported type values.
Usage
grid.pattern_wave(
  x = c(0, 0, 1, 1),
  y = c(1, 0, 0, 1),
  id = 1L,
  ...,
  colour = gp$col %||% "grey20",
  fill = gp$fill %||% "grey80",
  angle = 30,
  density = 0.2,
  spacing = 0.05,
  xoffset = 0,
  yoffset = 0,
  units = "snpc",
  amplitude = 0.5 * spacing,
  frequency = 1/spacing,
  alpha = gp$alpha %||% NA_real_,
  linetype = gp$lty %||% 1,
  linewidth = size %||% gp$lwd %||% 1,
  size = NULL,
  grid = "square",
  type = "indented",
  reverse = FALSE,
  stagger = FALSE,
  default.units = "npc",
  name = NULL,
  gp = gpar(),
  draw = TRUE,
  vp = NULL
)

names_wave
Arguments
- x
A numeric vector or unit object specifying x-locations of the pattern boundary.
- y
A numeric vector or unit object specifying y-locations of the pattern boundary.
- id
A numeric vector used to separate locations in x, y into multiple boundaries. All locations within the same
idbelong to the same boundary.- ...
Currently ignored.
- colour
Stroke colour(s).
- fill
Fill colour(s) or
grid::pattern()/ gradient object(s).- angle
Rotation angle in degrees.
- density
Approx. fraction of area the pattern fills.
- spacing
Spacing between repetitions of pattern (in
unitsunits).- xoffset
Shift pattern along x axis (in
unitsunits).- yoffset
Shift pattern along y axis (in
unitsunits).- units
grid::unit()units foramplitude,frequency,spacing,xoffset, andyoffsetparameters.- amplitude
Wave amplitude (in
unitsunits)- frequency
Linear frequency (in inverse
unitsunits)- alpha
Alpha (between 0 and 1) or
NA(default, preserves colors' alpha value).- linetype
Stroke linetype.
- linewidth
Stroke linewidth.
- size
For backwards compatibility can be used to set
linewidth.- grid
Adjusts placement and density of certain graphical elements.
"square"(default) is a square grid."hex"is a hexagonal grid suitable for hexagonal and triangular tiling."hex_circle"is a hexagonal grid suitable for circle packing."elongated_triangle"is a grid used for the "elongated triangle" tiling.- type
One of the following (see
names_wavefor the canonical list):"dovetailed"A wave with diagonal strokes connecting the crests and troughs. Alias:
"dovetail"."embattled"Square wave. Alias:
"square"."embattled_grady"Graduated stepped wave: two ascending steps followed by two descending steps per period.
"engrailed"Repeating arches curving downward (non-positive half of a sine wave per period).
"indented"(default)Triangular wave with equal rise and fall. Alias:
"triangle"."invected"Repeating arches curving upward (non-negative half of a sine wave per period).
"nebuly"Smooth cloud-like wave.
"potenty"A stepped wave with T-shaped crenellations.
"raguly"Oblique stepped wave. Use
reverse = TRUEfor the horizontally mirror image."sawtoothed"Sawtooth wave with a gradual rise and sharp fall. Use
reverse = TRUEfor a sharp rise and gradual fall. Aliases:"sawlike","sawtooth"."urdy"A wave with pointed crests and troughs.
"wavy"Smooth sinusoidal wave. Aliases:
"sine","undy".
- reverse
If
TRUE, horizontally mirror the wave. Currently affects"sawtoothed"and"raguly"only. DefaultFALSE.- stagger
If
TRUE, alternate wave rows are shifted by half a wavelength so that crests of one row align with troughs of adjacent rows, creating an interlocking effect. DefaultFALSE.- default.units
A string indicating the default units to use if
xoryare only given as numeric vectors.- name
A character identifier.
- gp
An object of class
"gpar", typically the output from a call to the functiongpar. This is basically a list of graphical parameter settings.- draw
A logical value indicating whether graphics output should be produced.
- vp
A Grid viewport object (or NULL).
Value
A grid grob object invisibly. If draw is TRUE then also draws to the graphic device as a side effect.
See also
Use grid.pattern_stripe() for straight filled bands or grid.pattern_line() for stroked lines instead of waves.
See https://en.wikipedia.org/wiki/Line_(heraldry) and https://en.wikipedia.org/wiki/Waveform for more information about the supported wave types.
Examples
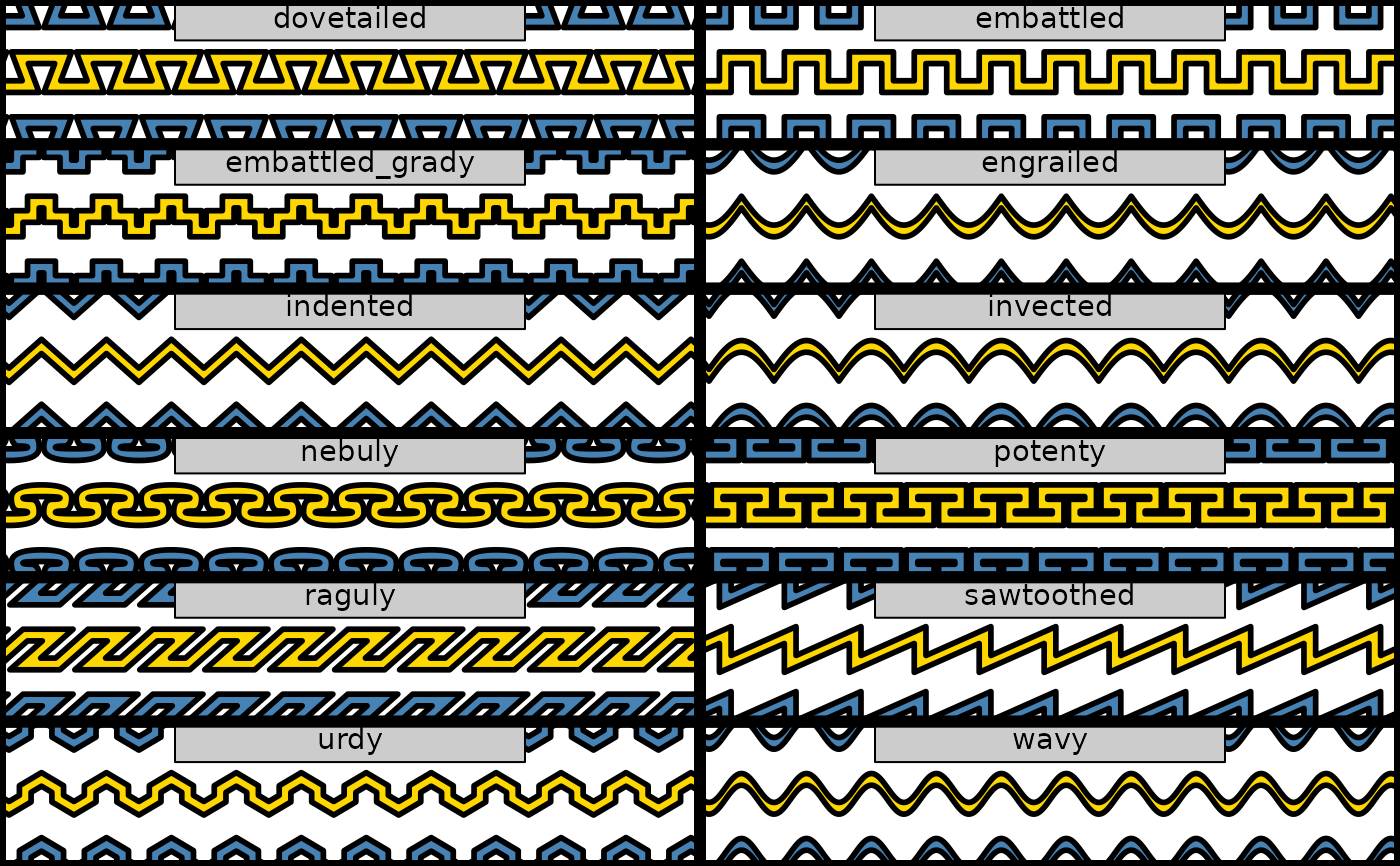
print(names_wave)
#> [1] "dovetailed" "embattled" "embattled_grady" "engrailed"
#> [5] "indented" "invected" "nebuly" "potenty"
#> [9] "raguly" "sawtoothed" "urdy" "wavy"
# visual table of all wave types
grid::grid.newpage()
n <- length(names_wave)
nc <- 2L
nr <- ceiling(n / nc)
grid::pushViewport(grid::viewport(layout = grid::grid.layout(nr, nc)))
for (i in seq_len(n)) {
grid::pushViewport(grid::viewport(
layout.pos.row = (i - 1L) %/% nc + 1L,
layout.pos.col = (i - 1L) %% nc + 1L
))
grid.pattern_wave(colour = "black", fill = c("gold", "steelblue"),
type = names_wave[i], density = 0.18, spacing = 0.45,
angle = 0, amplitude = 0.100, frequency = 1 / 0.45)
grid::grid.rect(x = 0.5, y = 0.86, width = 0.5, height = 0.28,
just = "centre", gp = grid::gpar(fill = "grey80", col = "black"))
grid::grid.text(names_wave[i], x = 0.5, y = 0.88,
gp = grid::gpar(fontsize = 11))
grid::grid.rect(gp = grid::gpar(fill = "transparent", col = "black", lwd = 6))
grid::popViewport()
}
grid::popViewport()
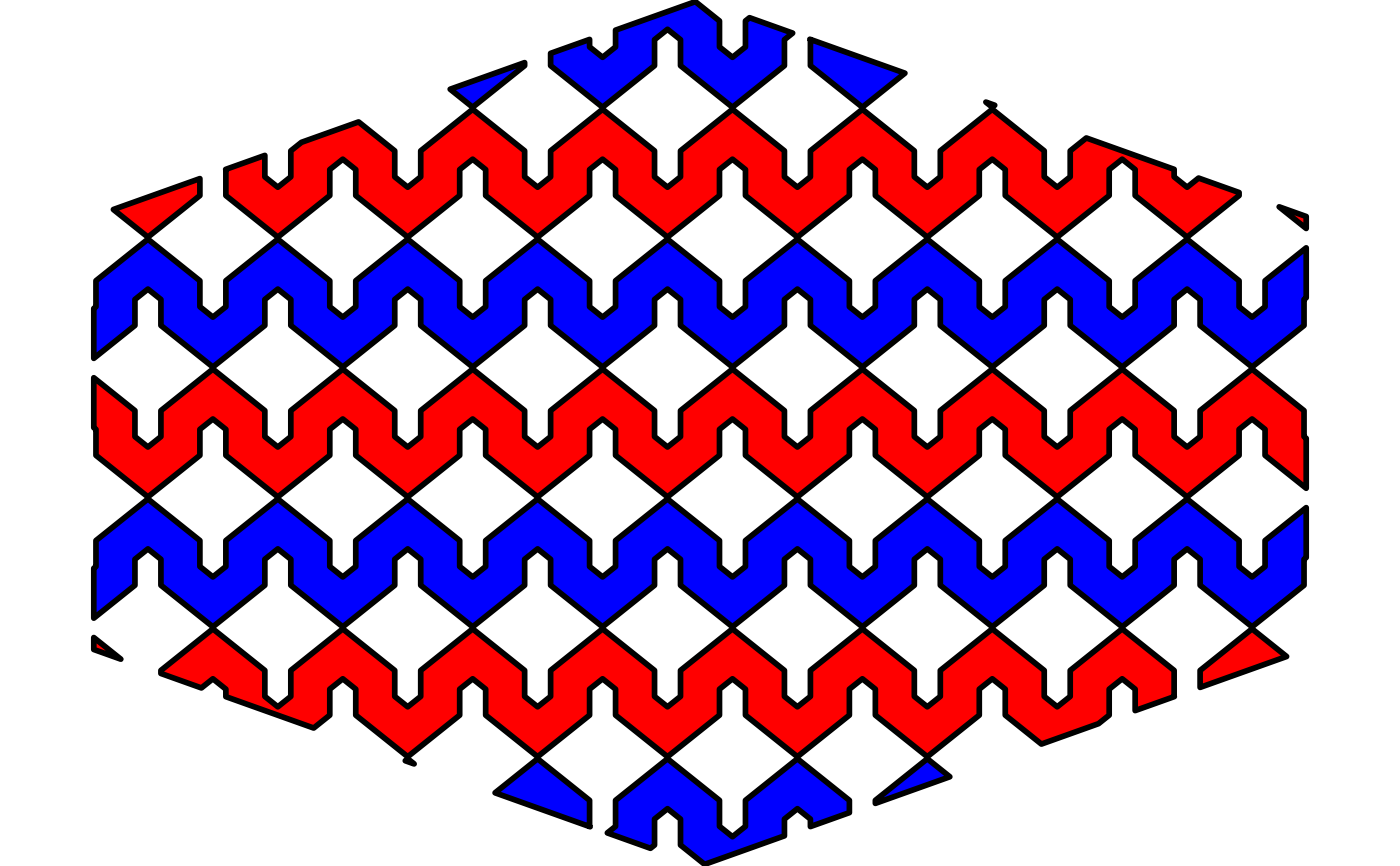
 # stagger shifts alternate rows by half a wavelength
grid::grid.newpage()
x_hex <- 0.5 + 0.5 * cos(seq(2 * pi / 4, by = 2 * pi / 6, length.out = 6))
y_hex <- 0.5 + 0.5 * sin(seq(2 * pi / 4, by = 2 * pi / 6, length.out = 6))
grid.pattern_wave(x_hex, y_hex, colour = "black", type = "urdy",
fill = c("red", "blue"), density = 0.3,
spacing = 0.15, angle = 0,
amplitude = 0.045, frequency = 1 / 0.15, stagger = TRUE)
# stagger shifts alternate rows by half a wavelength
grid::grid.newpage()
x_hex <- 0.5 + 0.5 * cos(seq(2 * pi / 4, by = 2 * pi / 6, length.out = 6))
y_hex <- 0.5 + 0.5 * sin(seq(2 * pi / 4, by = 2 * pi / 6, length.out = 6))
grid.pattern_wave(x_hex, y_hex, colour = "black", type = "urdy",
fill = c("red", "blue"), density = 0.3,
spacing = 0.15, angle = 0,
amplitude = 0.045, frequency = 1 / 0.15, stagger = TRUE)