
ETA histograms
Usage
eta_hist(df, x, xs = defx(), add_density = FALSE, ...)Arguments
- df
data frame to plot
- x
character col//label for x-axis data; see
col_label- xs
see
defx- add_density
if
TRUE, a normal density line will be plotted on top of the histogram viaadd_density- ...
other arguments for
geom_histogram
Value
A single plot when a single value for x
and y are supplied; a list of plots of either x
or y have length greater than 1.
Details
The x column must be numeric. This function
calls cont_hist.
Examples
df <- pmplots_data_id()
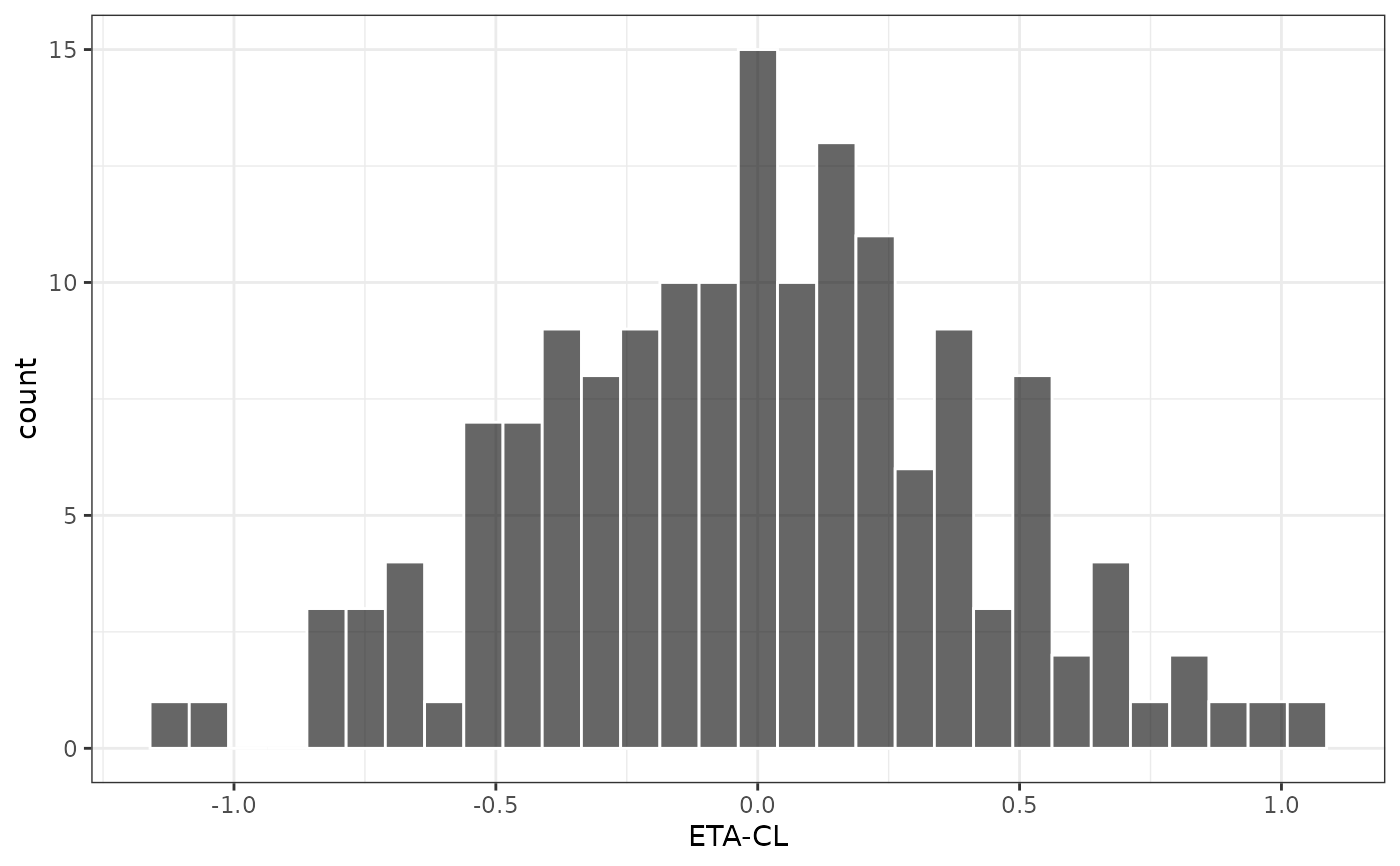
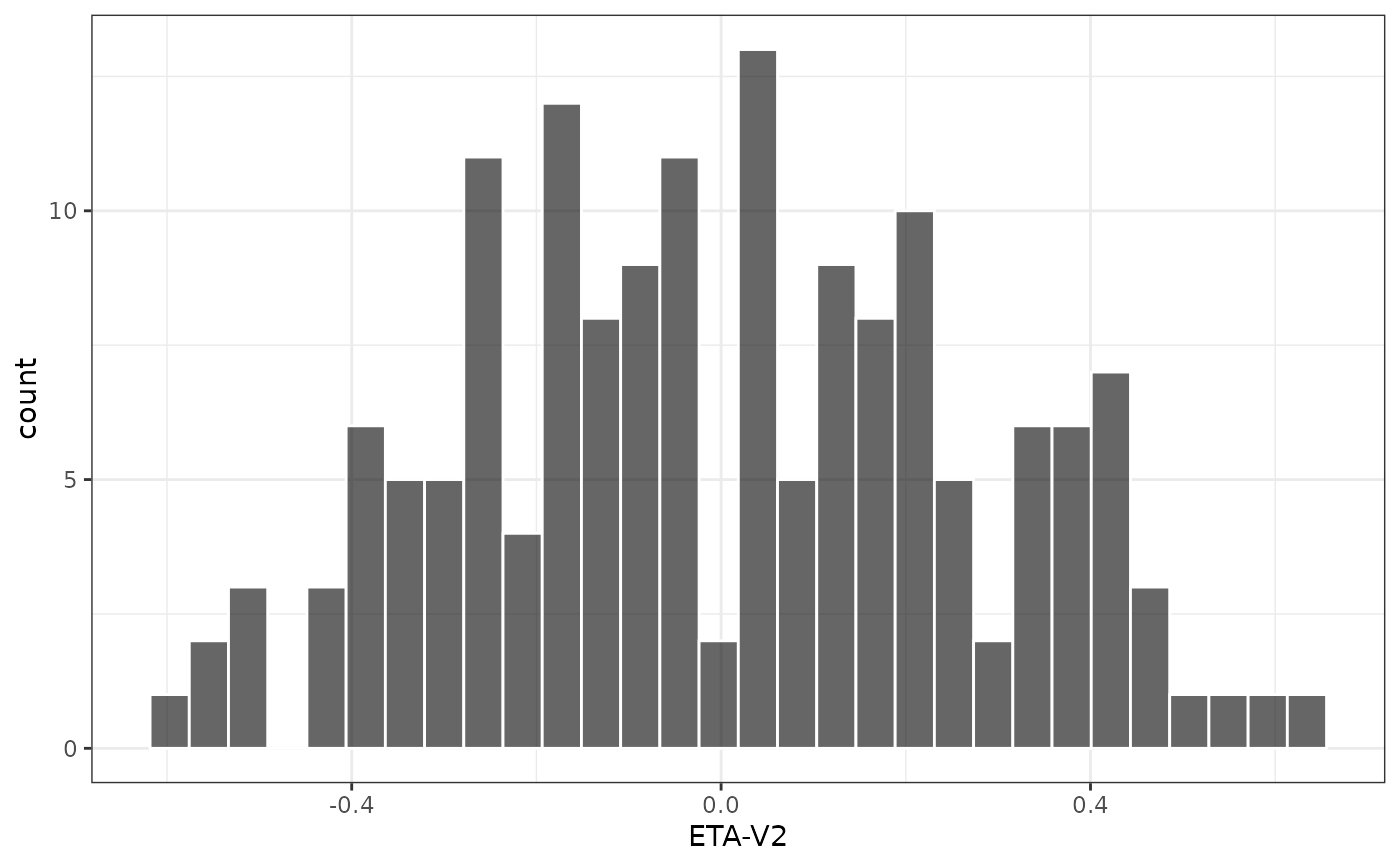
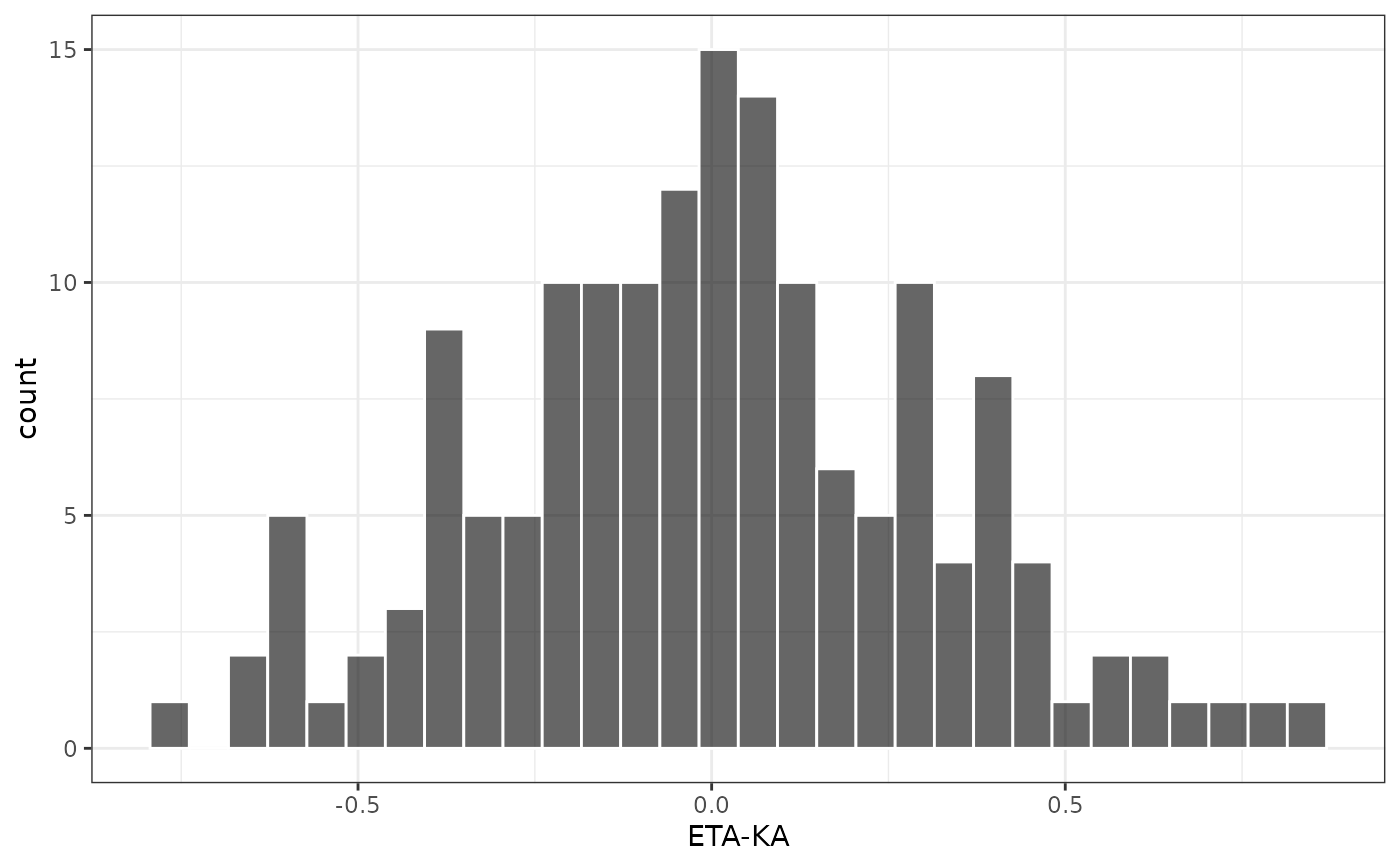
etas <- c("ETA1//ETA-CL", "ETA2//ETA-V2", "ETA3//ETA-KA")
eta_hist(df, etas)
#> [[1]]
#> `stat_bin()` using `bins = 30`. Pick better value `binwidth`.
 #>
#> [[2]]
#> `stat_bin()` using `bins = 30`. Pick better value `binwidth`.
#>
#> [[2]]
#> `stat_bin()` using `bins = 30`. Pick better value `binwidth`.
 #>
#> [[3]]
#> `stat_bin()` using `bins = 30`. Pick better value `binwidth`.
#>
#> [[3]]
#> `stat_bin()` using `bins = 30`. Pick better value `binwidth`.
 #>
#>