Arrange a named list of plots
Arguments
- x
a named list of gg objects to arrange.
- expr
a
patchworkformula for arranging plots inx.- tag_levels
passed to
patchwork::plot_annotation().
Examples
data <- pmplots_data_id()
etas <- paste0("ETA", 1:3)
covs <- c("WT", "AGE", "ALB")

x <- eta_covariate_list(data, x = covs, y = etas, transpose = TRUE)

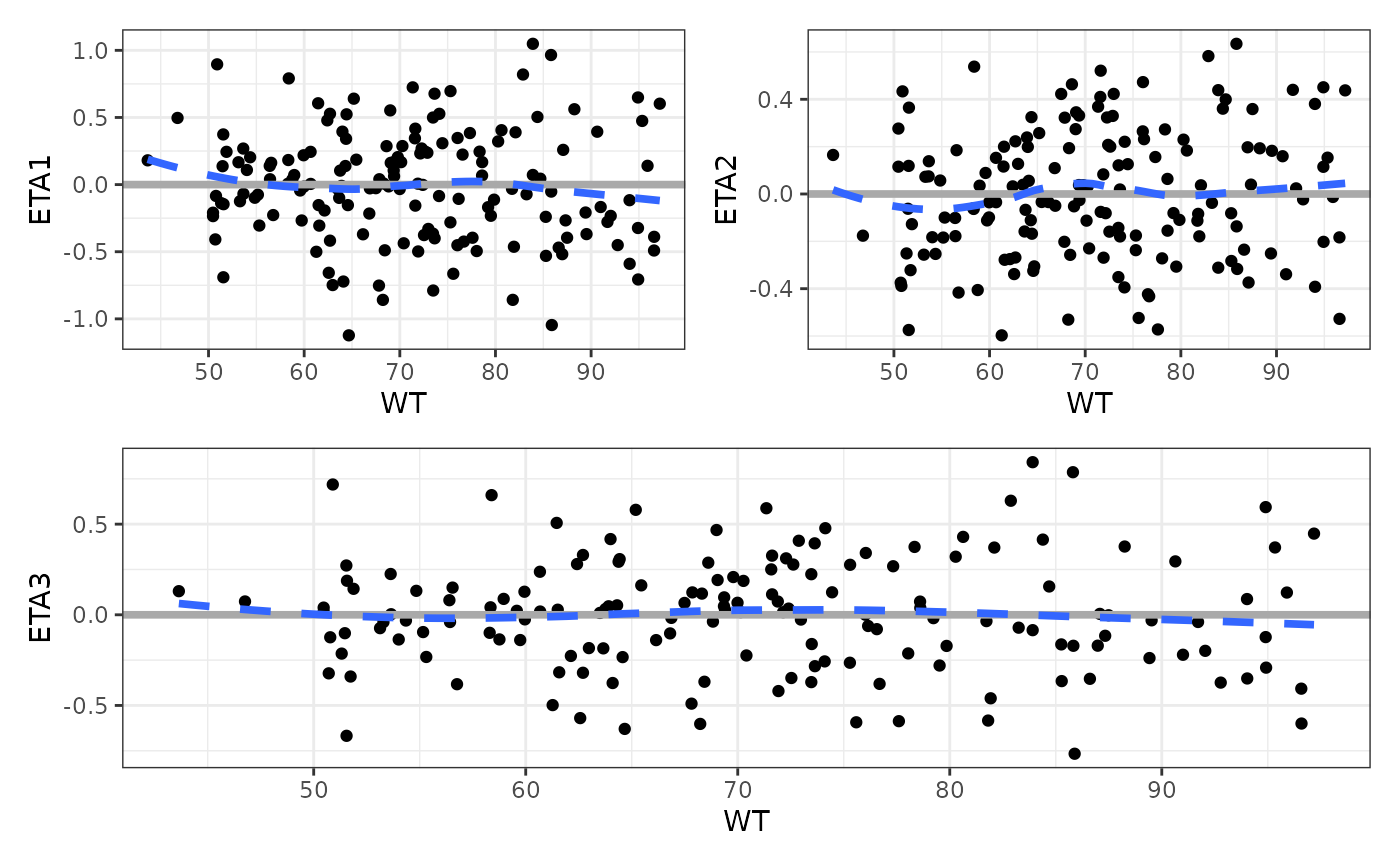
pm_with(x$WT, (ETA1 + ETA2) / ETA3)
#> `geom_smooth()` using formula = 'y ~ x'
#> `geom_smooth()` using formula = 'y ~ x'
#> `geom_smooth()` using formula = 'y ~ x'