
Get a single graphic of ETA versus continuous and / or categorical
covariates (eta_covariate()) or the component plots as a list
that can be arranged by the user (eta_covariate_list()).
Usage
eta_covariate(
  df,
  x,
  y,
  ncol = 2,
  tag_levels = NULL,
  byrow = NULL,
  transpose = FALSE,
  points = NULL
)

eta_covariate_list(df, x, y, transpose = FALSE, points = NULL)
Arguments
- df
a data frame to plot.
- x
character
col//titlefor covariates to plot on x-axis; seecol_label().- y
character
col//titlefor ETAs to plot on y-axis; seecol_label().- ncol
passed to
pm_grid().- tag_levels
passed to
patchwork::plot_annotation().- byrow
passed to
pm_grid().- transpose
logical; if
TRUE, output will be transposed to group plots by the covariate, rather than theETA; see Examples.- points
passed to
boxwork()when plotting categorical covariates.
Value
eta_covariate() returns a list of plots arranged in graphics as a
patchwork object using pm_grid(). eta_covariate_list() the same
plots, but unarranged as a list of lists.
When transpose is FALSE (default), plots in a single graphic are grouped
by the ETA, and the names of the list reflect that name (e.g., ETA1).
When transpose is TRUE, the graphics are grouped by column names passed
via x and the names of the list reflect those covariate data names. See
Examples.
Details
Pass ncol = NULL or another non-numeric value to bypass arranging plots
coming from eta_covariate().
Examples
data <- pmplots_data_id()
etas <- c("ETA1//ETA-CL", "ETA2//ETA-V")
cont <- c("WT//Weight (kg)", "ALB//Albumin (mg/dL)")
cats <- c("RF//Renal function", "CPc//Child-Pugh")
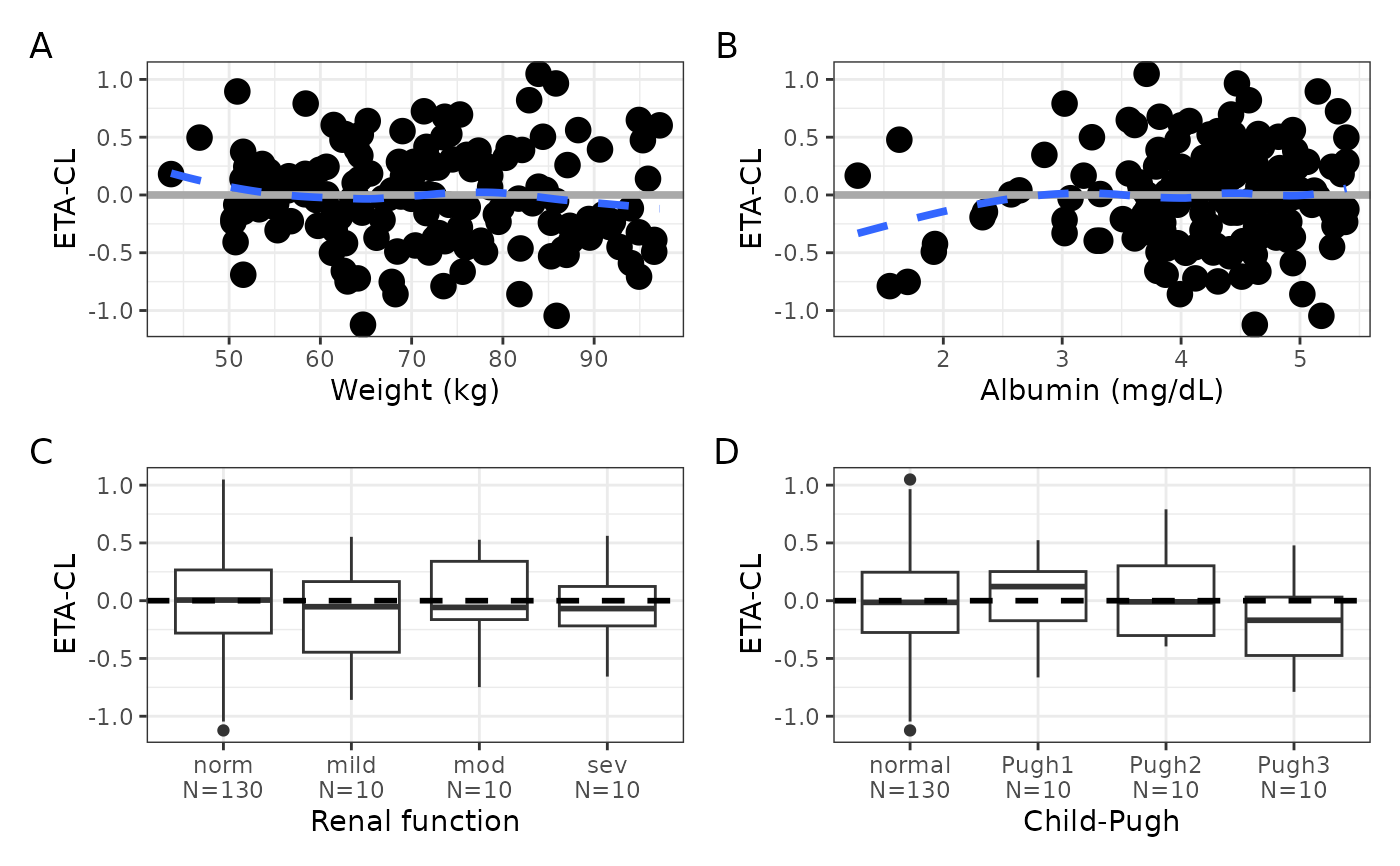
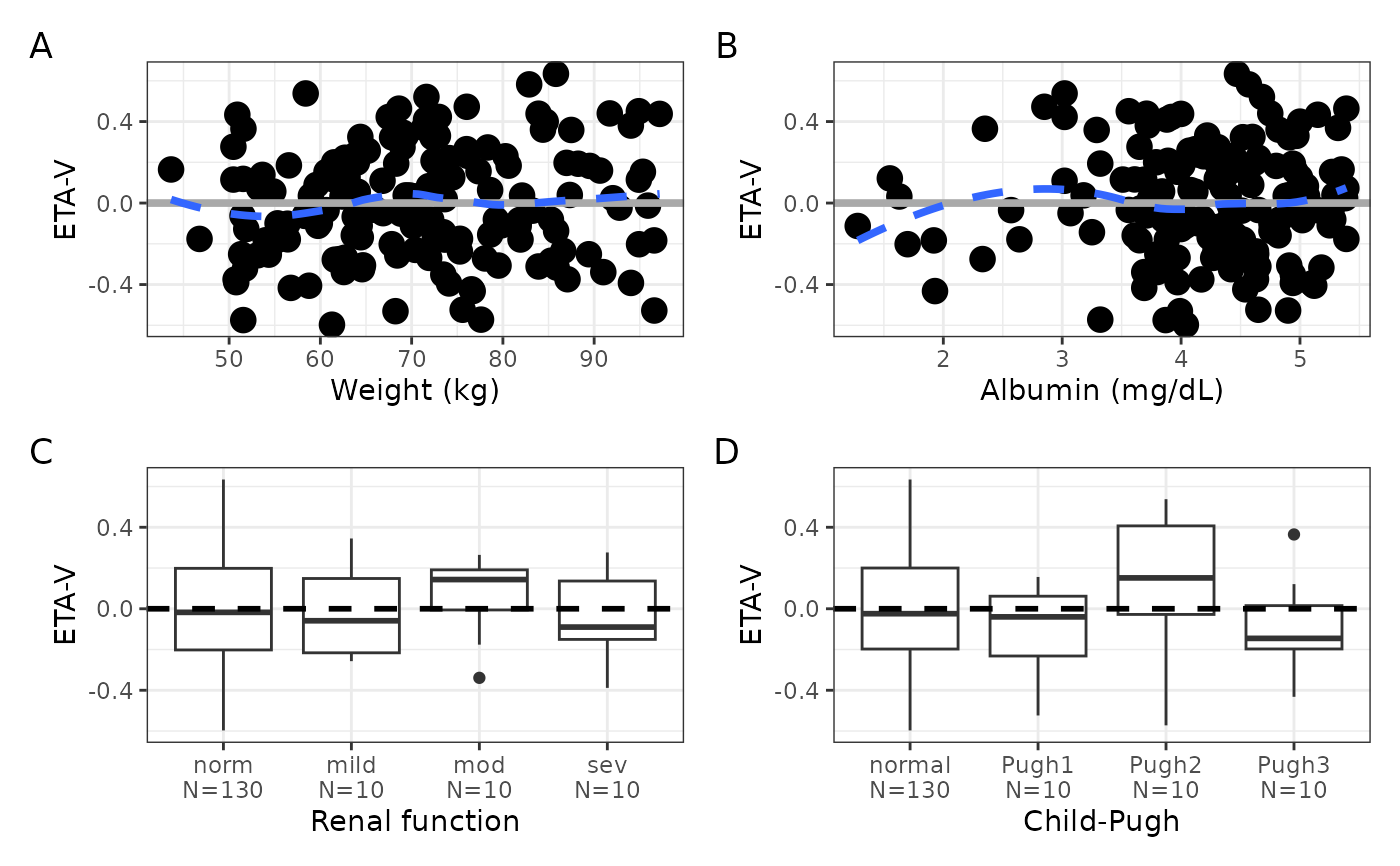
eta_covariate(data, x = c(cont, cats), y = etas, tag_levels = "A")
#> $ETA1
#> `geom_smooth()` using formula = 'y ~ x'
#> `geom_smooth()` using formula = 'y ~ x'
 #>
#> $ETA2
#> `geom_smooth()` using formula = 'y ~ x'
#> `geom_smooth()` using formula = 'y ~ x'
#>
#> $ETA2
#> `geom_smooth()` using formula = 'y ~ x'
#> `geom_smooth()` using formula = 'y ~ x'
 #>
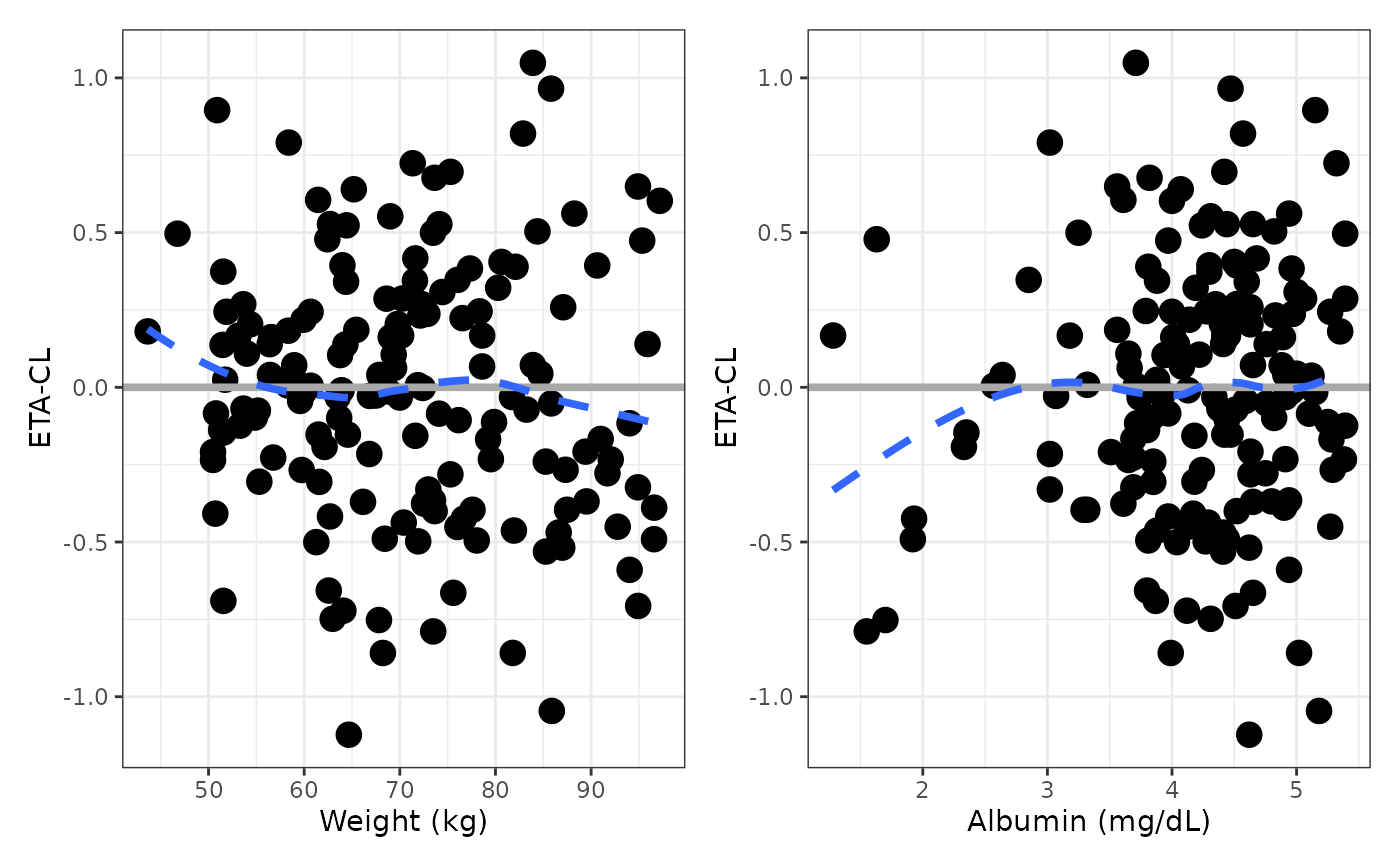
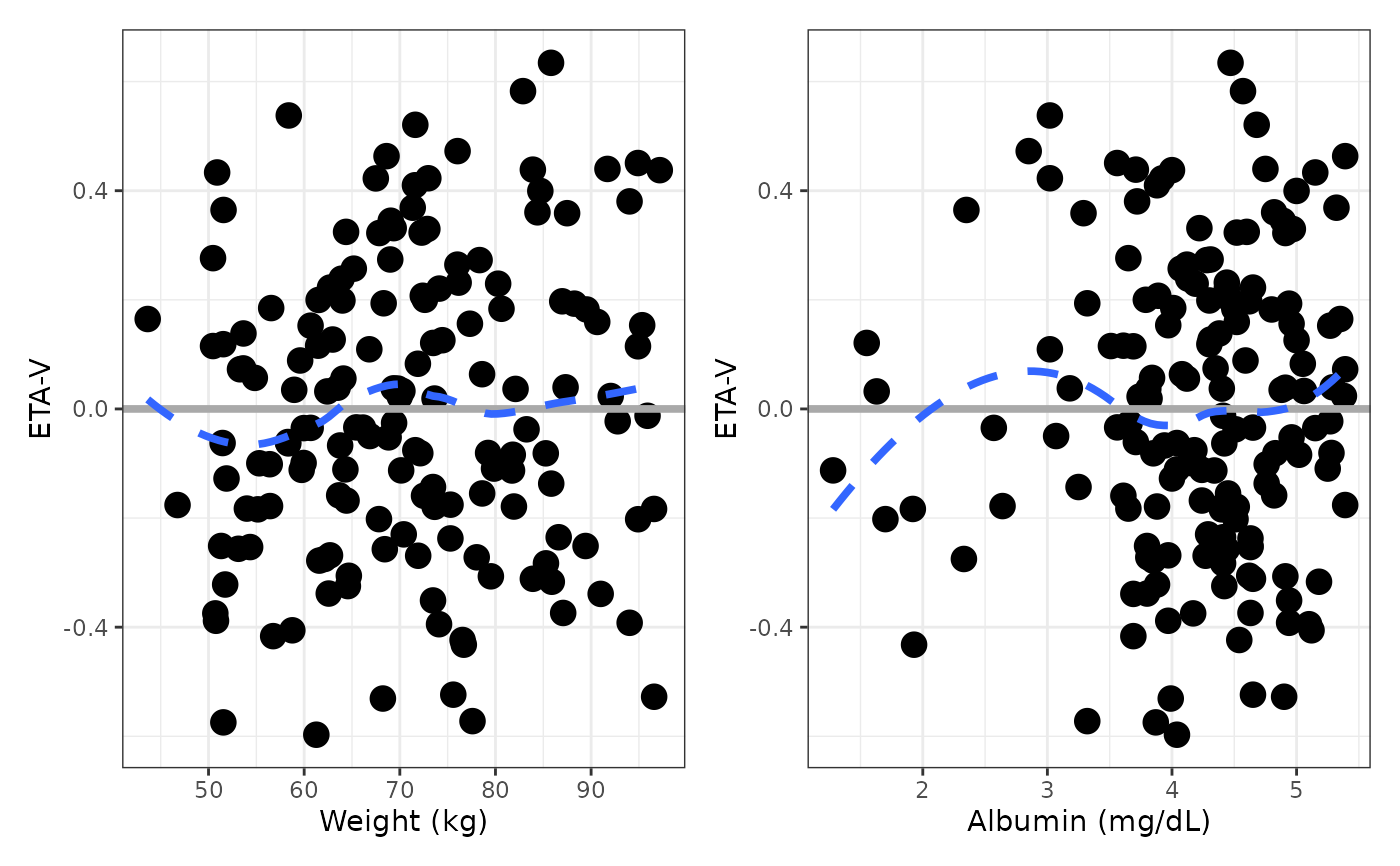
eta_covariate(data, cont, y = etas)
#> $ETA1
#> `geom_smooth()` using formula = 'y ~ x'
#> `geom_smooth()` using formula = 'y ~ x'
#>
eta_covariate(data, cont, y = etas)
#> $ETA1
#> `geom_smooth()` using formula = 'y ~ x'
#> `geom_smooth()` using formula = 'y ~ x'
 #>
#> $ETA2
#> `geom_smooth()` using formula = 'y ~ x'
#> `geom_smooth()` using formula = 'y ~ x'
#>
#> $ETA2
#> `geom_smooth()` using formula = 'y ~ x'
#> `geom_smooth()` using formula = 'y ~ x'
 #>
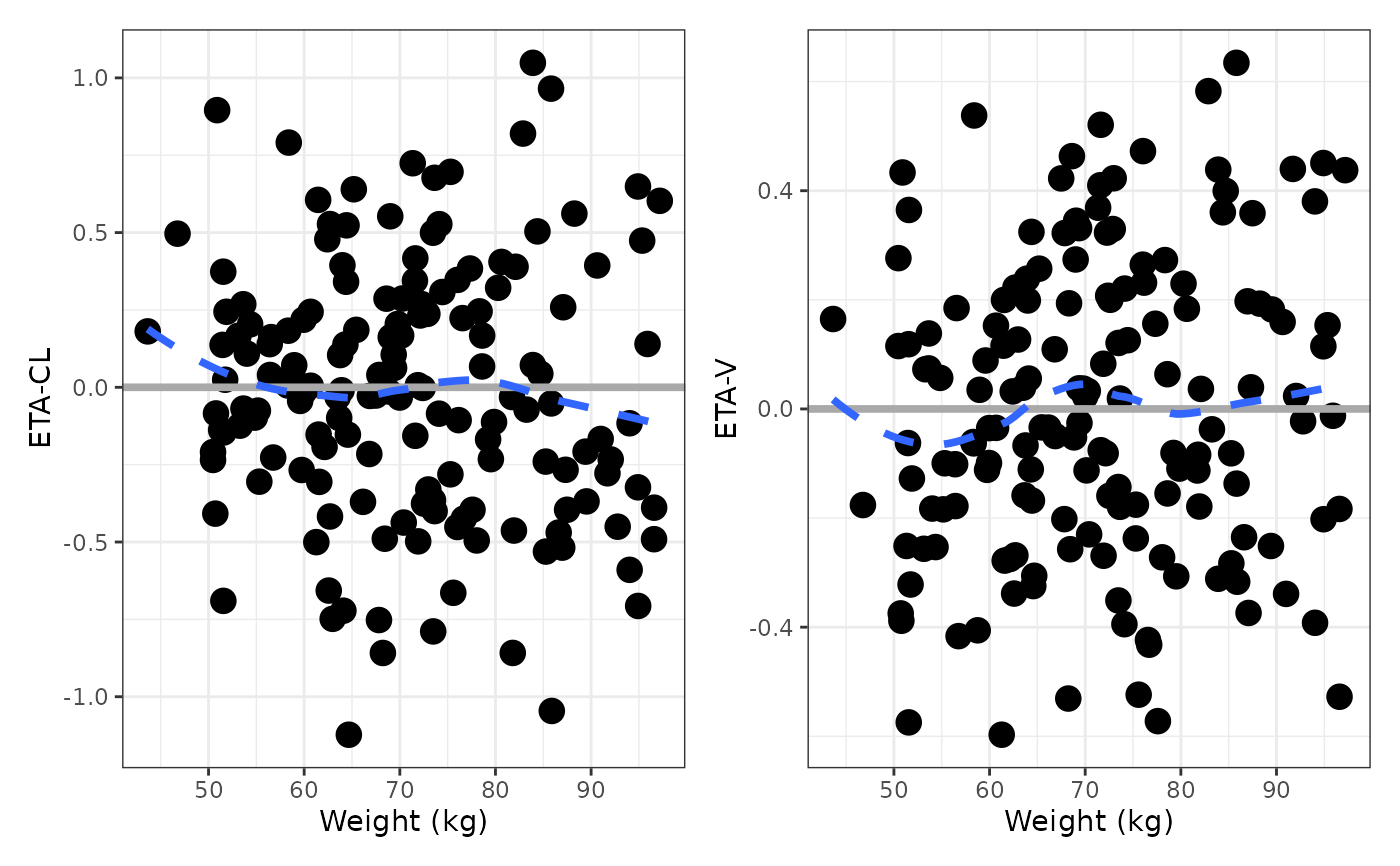
eta_covariate(data, cont, y = etas, transpose = TRUE)
#> $WT
#> `geom_smooth()` using formula = 'y ~ x'
#> `geom_smooth()` using formula = 'y ~ x'
#>
eta_covariate(data, cont, y = etas, transpose = TRUE)
#> $WT
#> `geom_smooth()` using formula = 'y ~ x'
#> `geom_smooth()` using formula = 'y ~ x'
 #>
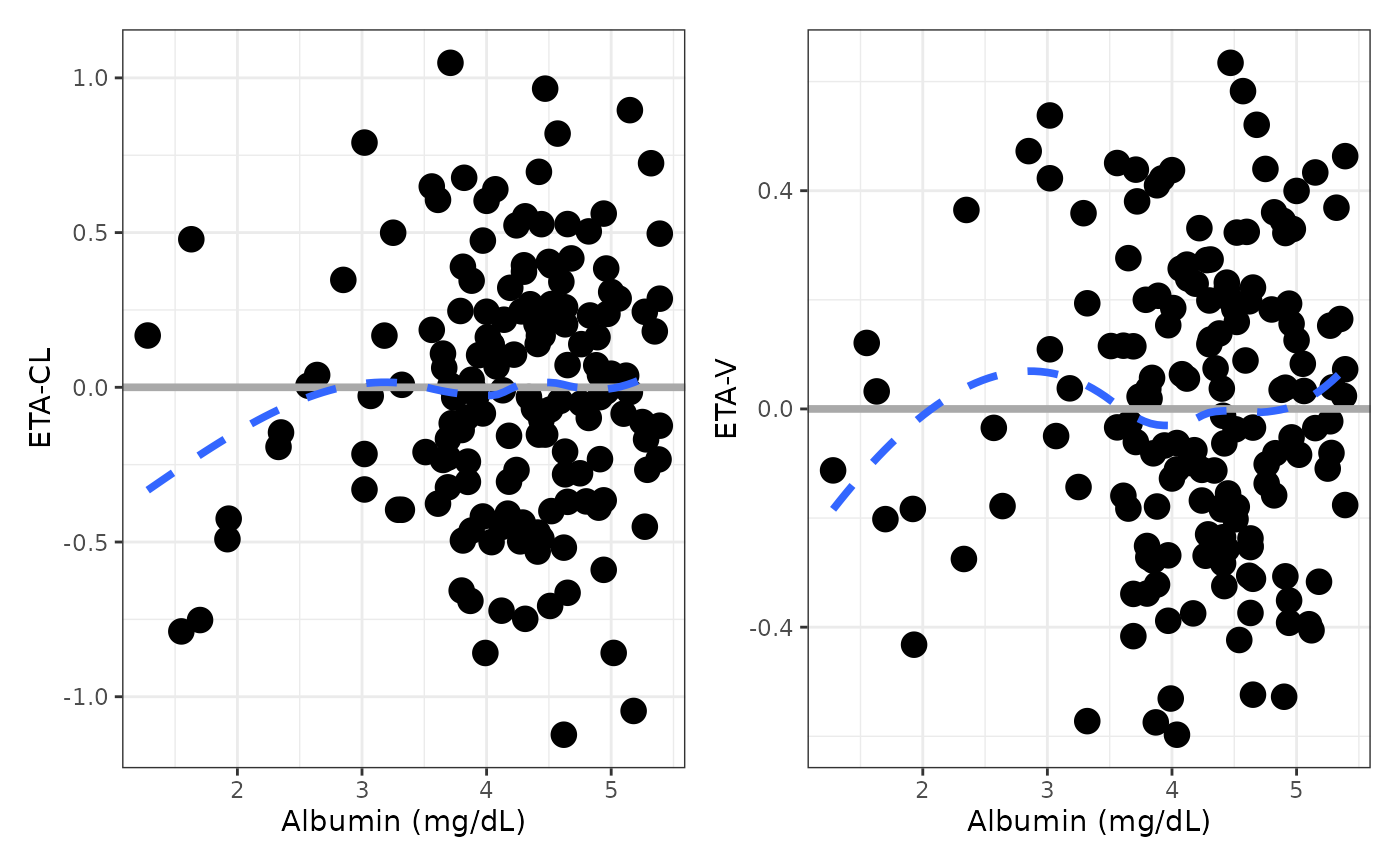
#> $ALB
#> `geom_smooth()` using formula = 'y ~ x'
#> `geom_smooth()` using formula = 'y ~ x'
#>
#> $ALB
#> `geom_smooth()` using formula = 'y ~ x'
#> `geom_smooth()` using formula = 'y ~ x'
 #>
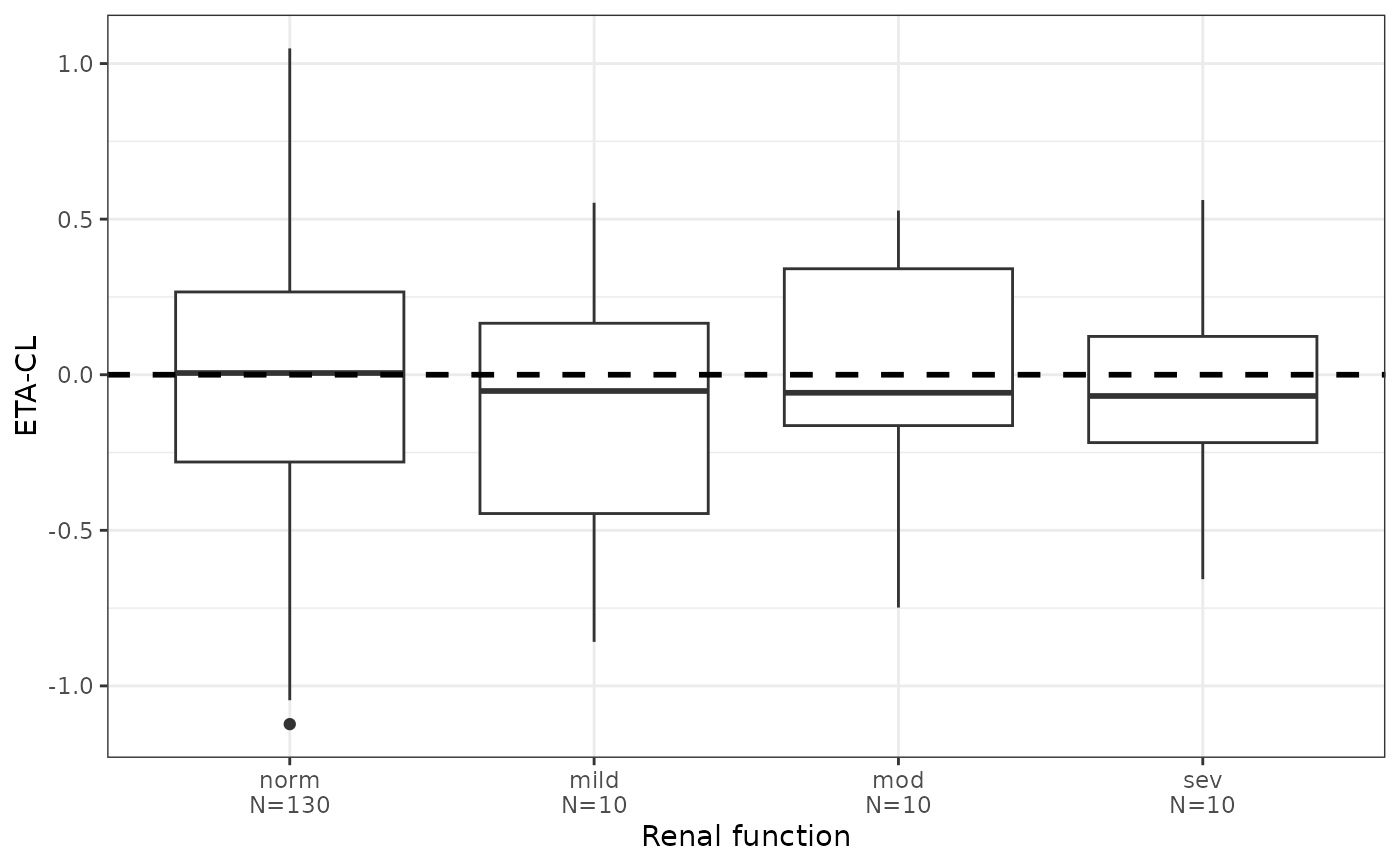
eta_covariate_list(data, x = cats, y = etas)
#> $ETA1
#> $RF
#>
eta_covariate_list(data, x = cats, y = etas)
#> $ETA1
#> $RF
 #>
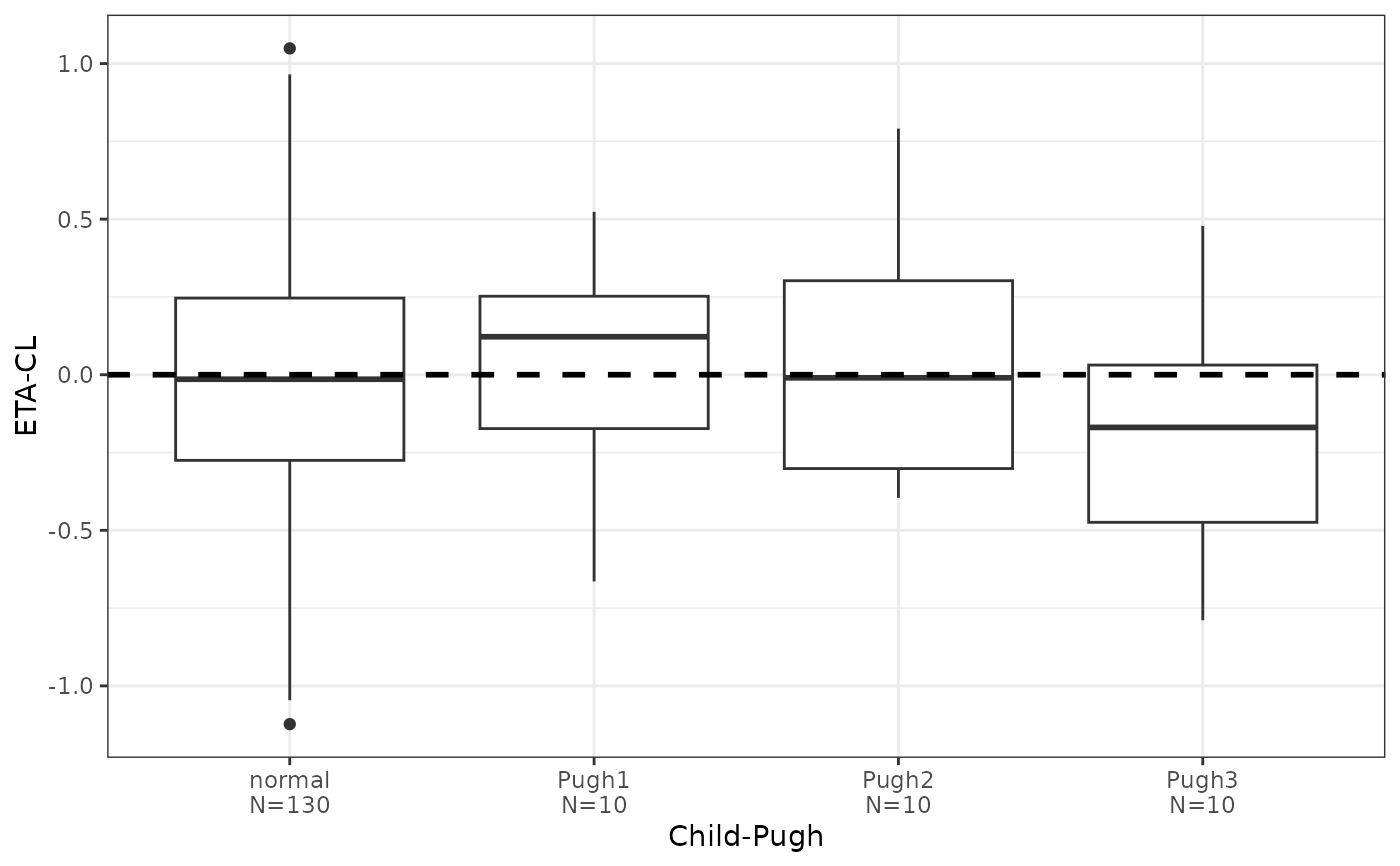
#> $CPc
#>
#> $CPc
 #>
#> attr(,"class")
#> [1] "pm_display" "list"
#>
#> $ETA2
#> $RF
#>
#> attr(,"class")
#> [1] "pm_display" "list"
#>
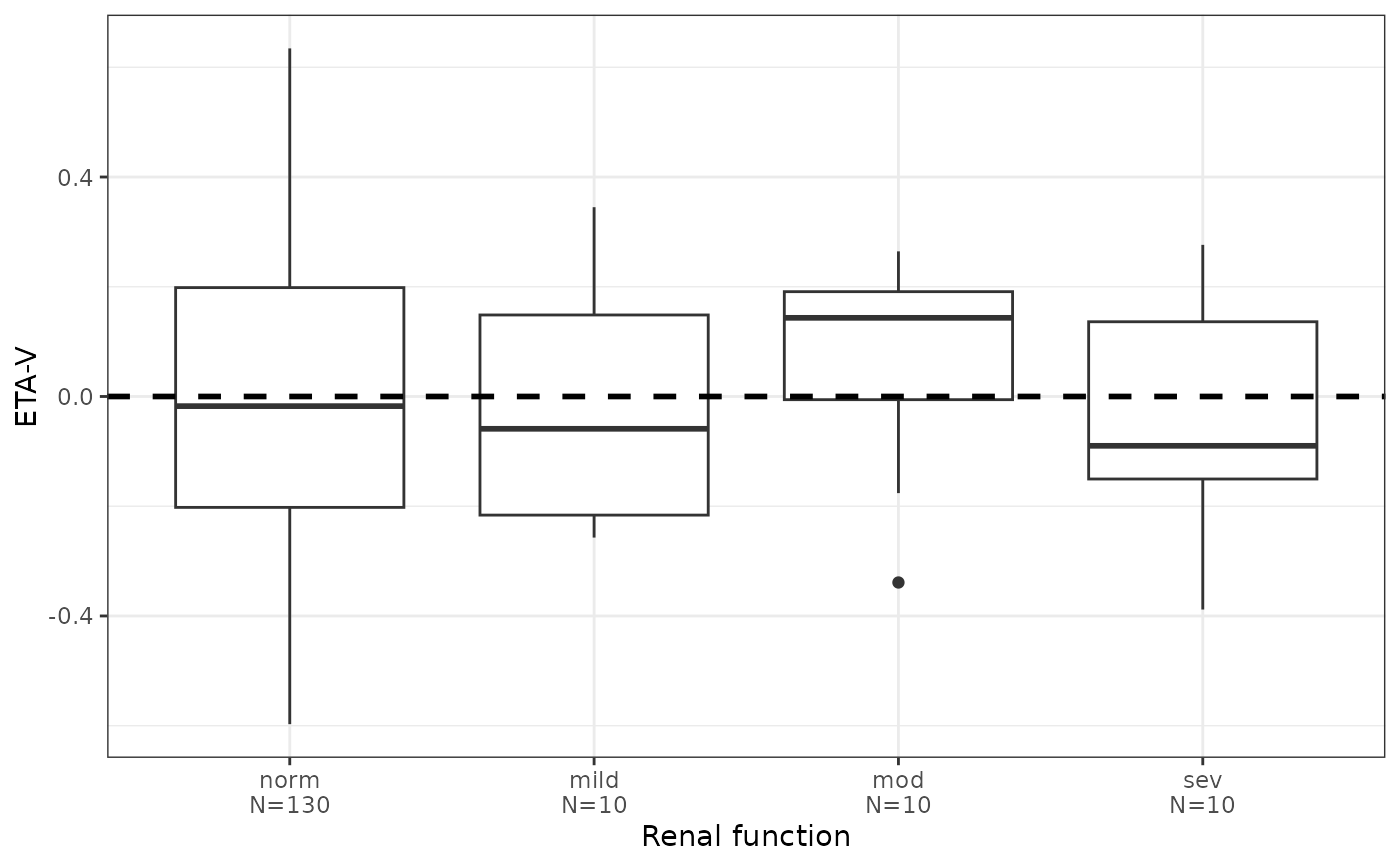
#> $ETA2
#> $RF
 #>
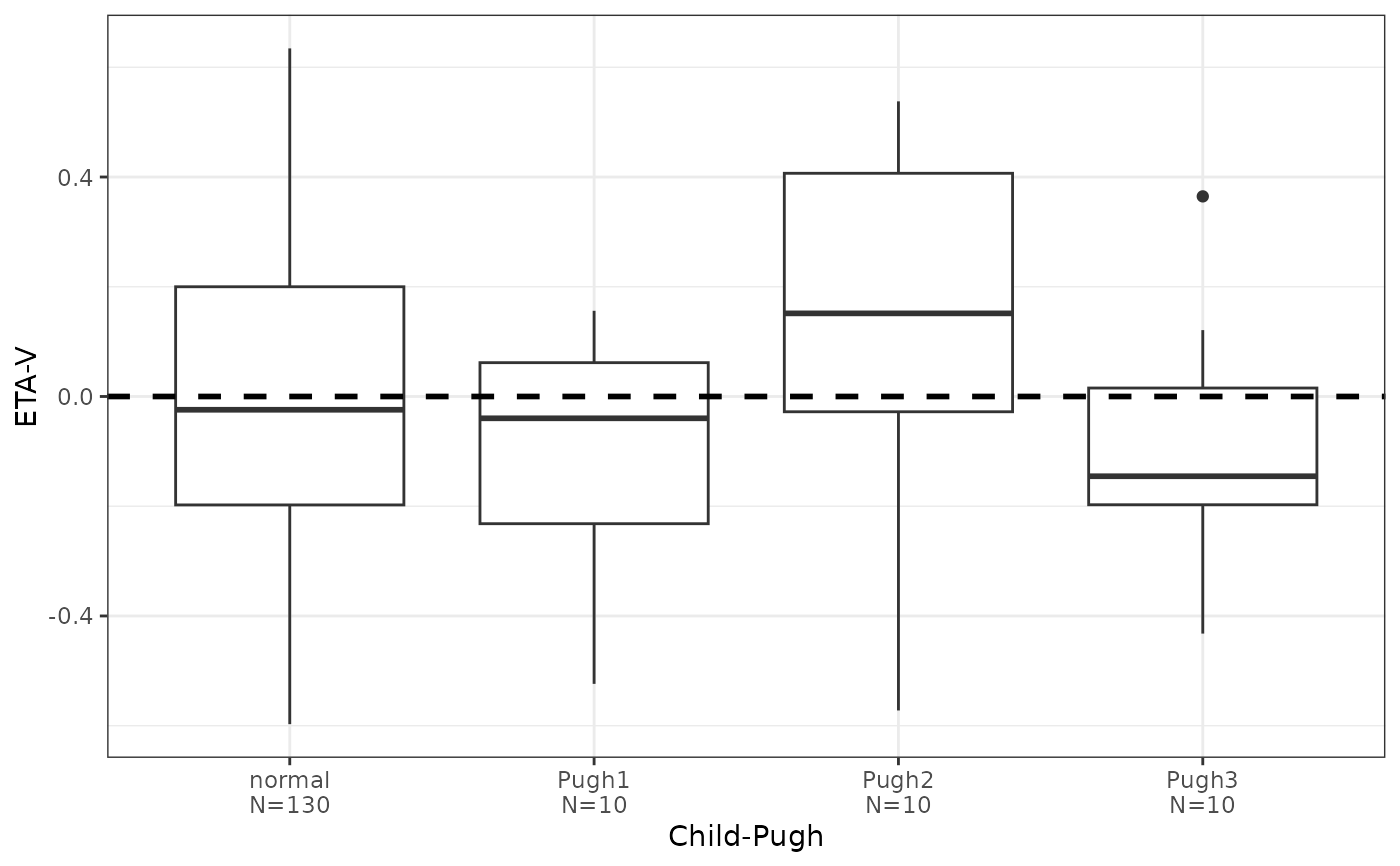
#> $CPc
#>
#> $CPc
 #>
#> attr(,"class")
#> [1] "pm_display" "list"
#>
eta_covariate_list(data, x = cats, y = etas, transpose = TRUE)
#> $RF
#> $ETA1
#>
#> attr(,"class")
#> [1] "pm_display" "list"
#>
eta_covariate_list(data, x = cats, y = etas, transpose = TRUE)
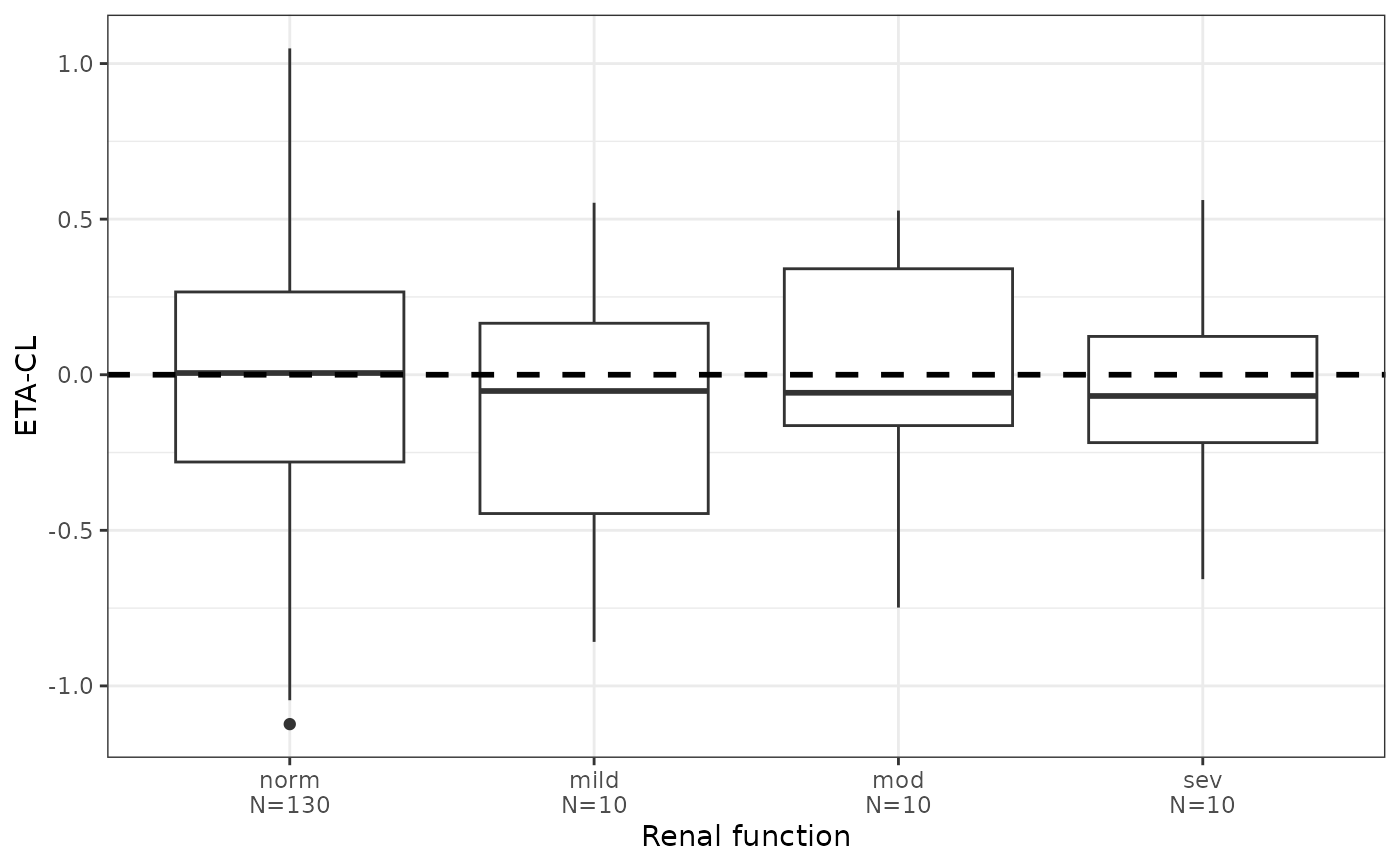
#> $RF
#> $ETA1
 #>
#> $ETA2
#>
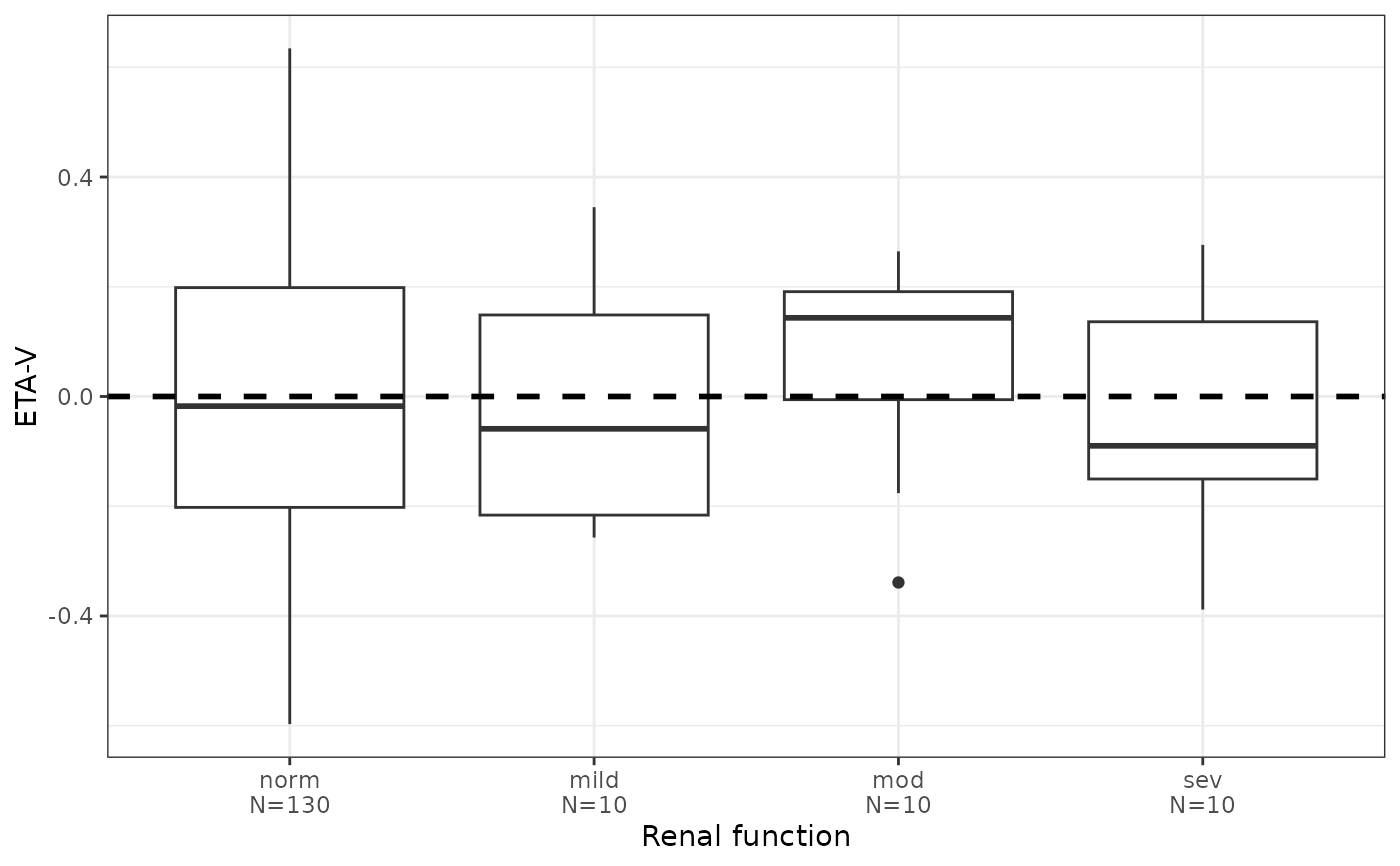
#> $ETA2
 #>
#> attr(,"class")
#> [1] "pm_display" "list"
#>
#> $CPc
#> $ETA1
#>
#> attr(,"class")
#> [1] "pm_display" "list"
#>
#> $CPc
#> $ETA1
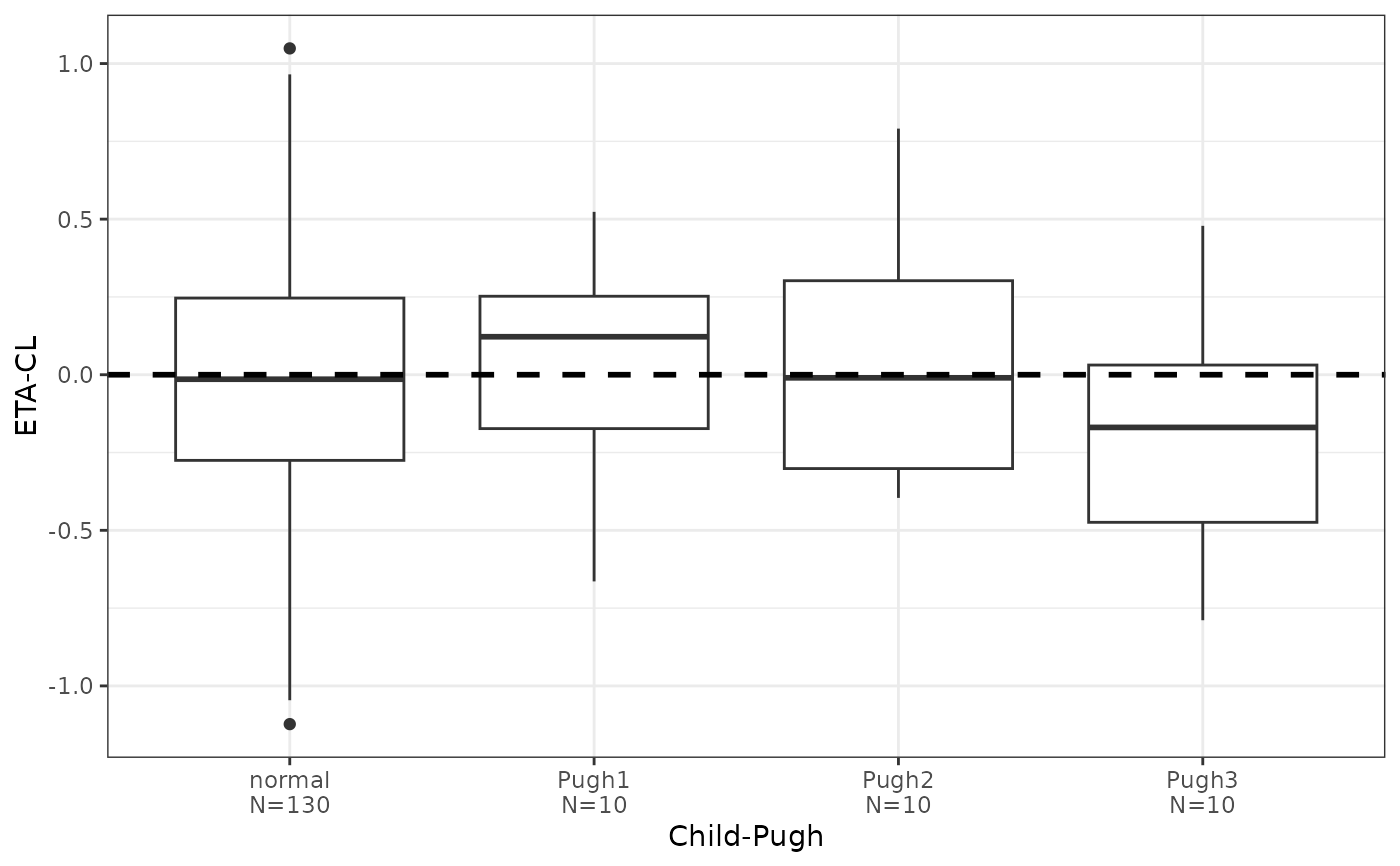 #>
#> $ETA2
#>
#> $ETA2
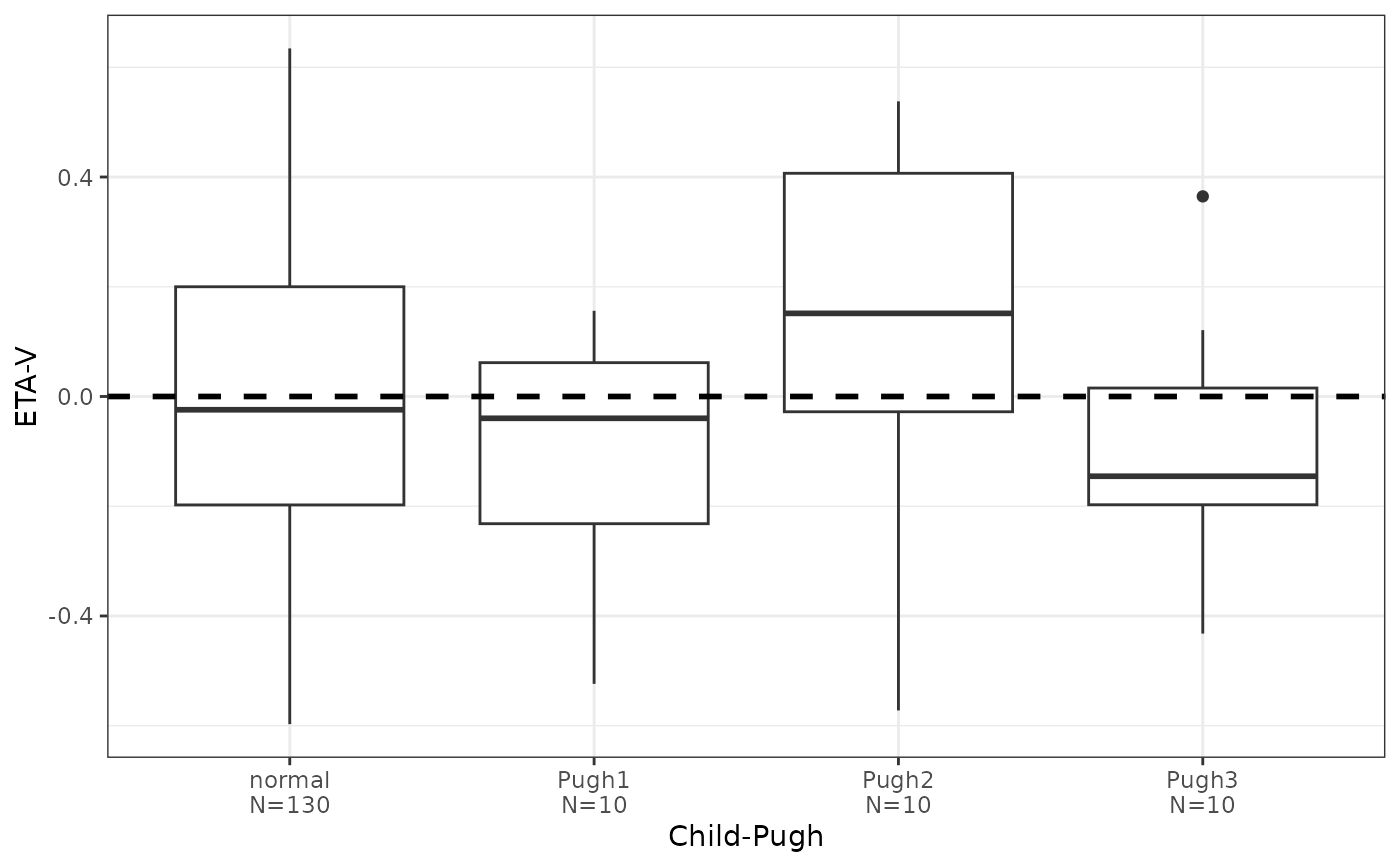 #>
#> attr(,"class")
#> [1] "pm_display" "list"
#>
#>
#> attr(,"class")
#> [1] "pm_display" "list"
#>