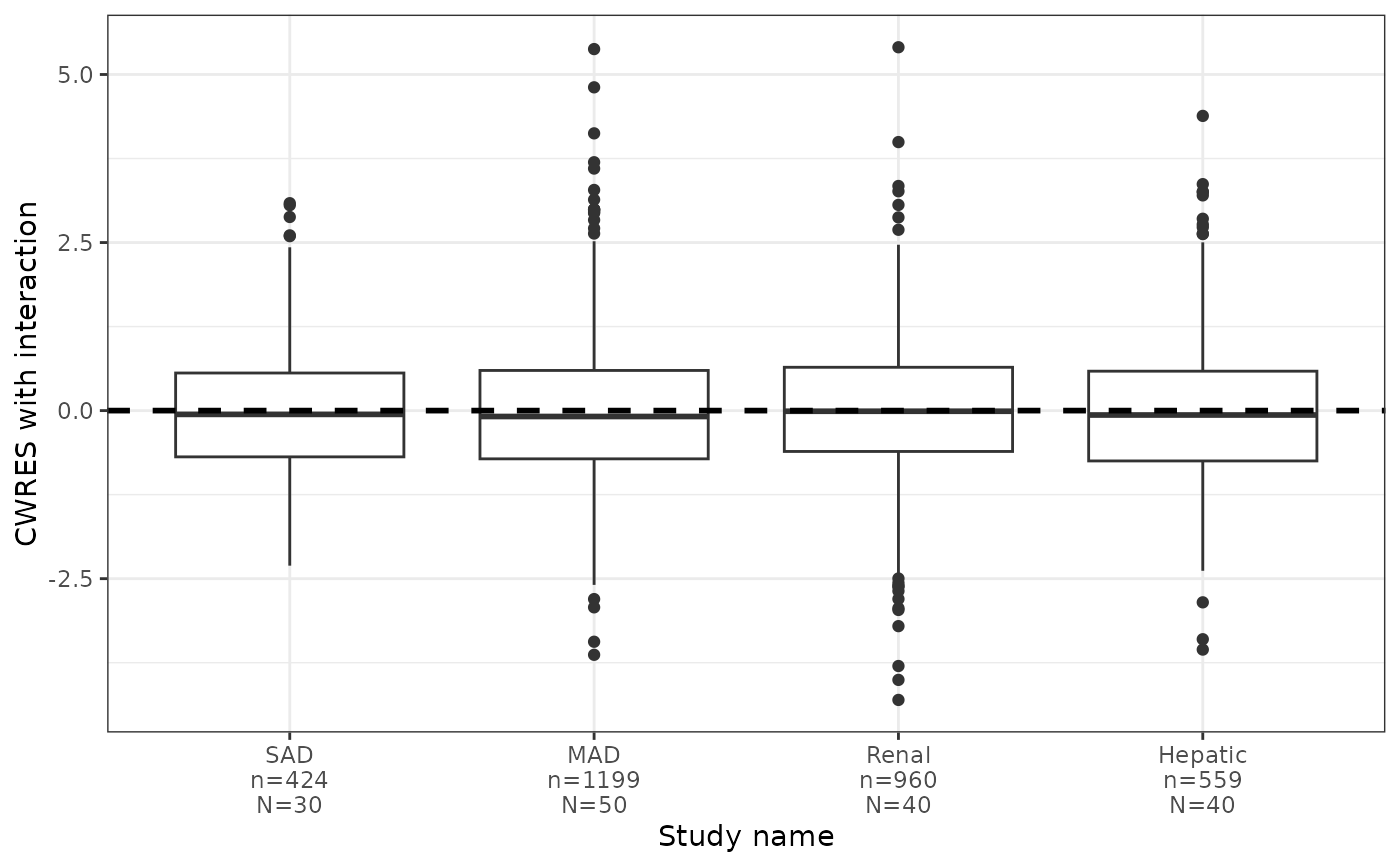
These are vectorized functions. See details.
Usage
res_cat(df, x, y = pm_axis_res(), hline = 0, ...)

wres_cat(df, x, y = pm_axis_wres(), hline = 0, ...)

cwres_cat(df, x, y = pm_axis_cwres(), hline = 0, ...)

cwresi_cat(df, x, y = pm_axis_cwresi(), ...)

npde_cat(df, x, y = pm_axis_npde(), ...)Value
A single plot when a single value for x
and y are supplied; a list of plots of either x
or y have length greater than 1.
Details
These are vectorized functions; if either x or y are a character vector (in col//title format), a list of plots is returned. If both x and y are length 1, then a single plot object (not a list) is returned.
Since this function creates a boxplot,
the x column must be character, factor
or logical and y column must
be numeric.
Summary numbers located below each box are described in
boxwork. The summaries will not be correct if the plot
is eventually faceted by another variable in the data set. In this case,
either use shown=FALSE or create the plot with
split_plot.
Examples
df <- pmplots_data_obs()

cwresi_cat(df, x="STUDYc//Study name")