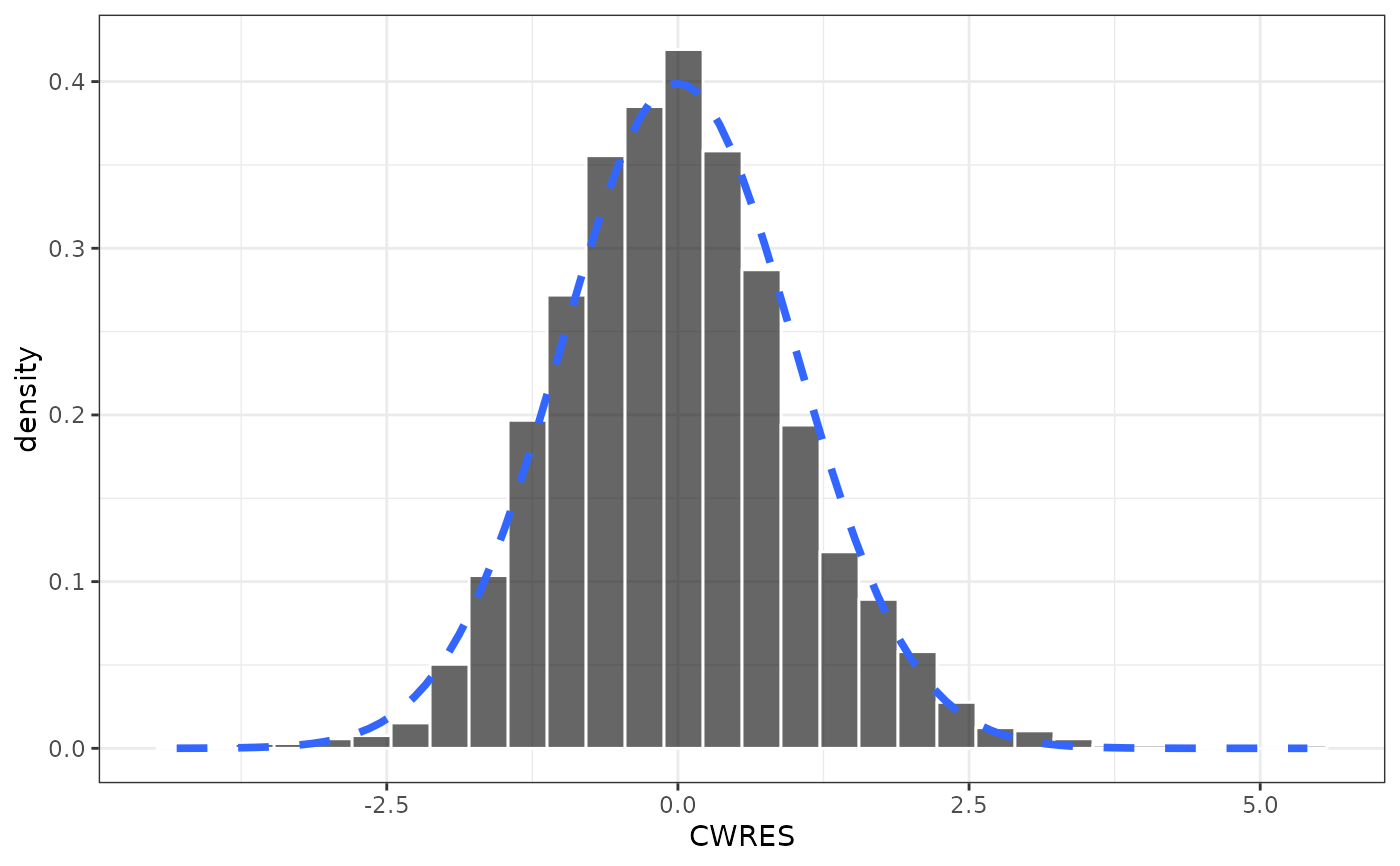
Histograms of residuals or NPDE
Usage
res_hist(df, ..., x = pm_axis_res(), xs = defx())

wres_hist(df, ..., x = pm_axis_wres(), y = "density")

cwres_hist(df, ..., x = pm_axis_cwres())

cwresi_hist(df, x = pm_axis_cwresi(), ...)

npde_hist(df, ..., x = pm_axis("npde"))
Arguments
- df
data frame to plot.
- ...
passed to
cont_hist()- x
character name for x-axis data.
- xs
see
defx().- y
what to use for the y-axis on the histogram; can be "count"
or"density"`.
Examples
df <- pmplots_data_obs()

cwres_hist(df)
#> `stat_bin()` using `bins = 30`. Pick better value `binwidth`.