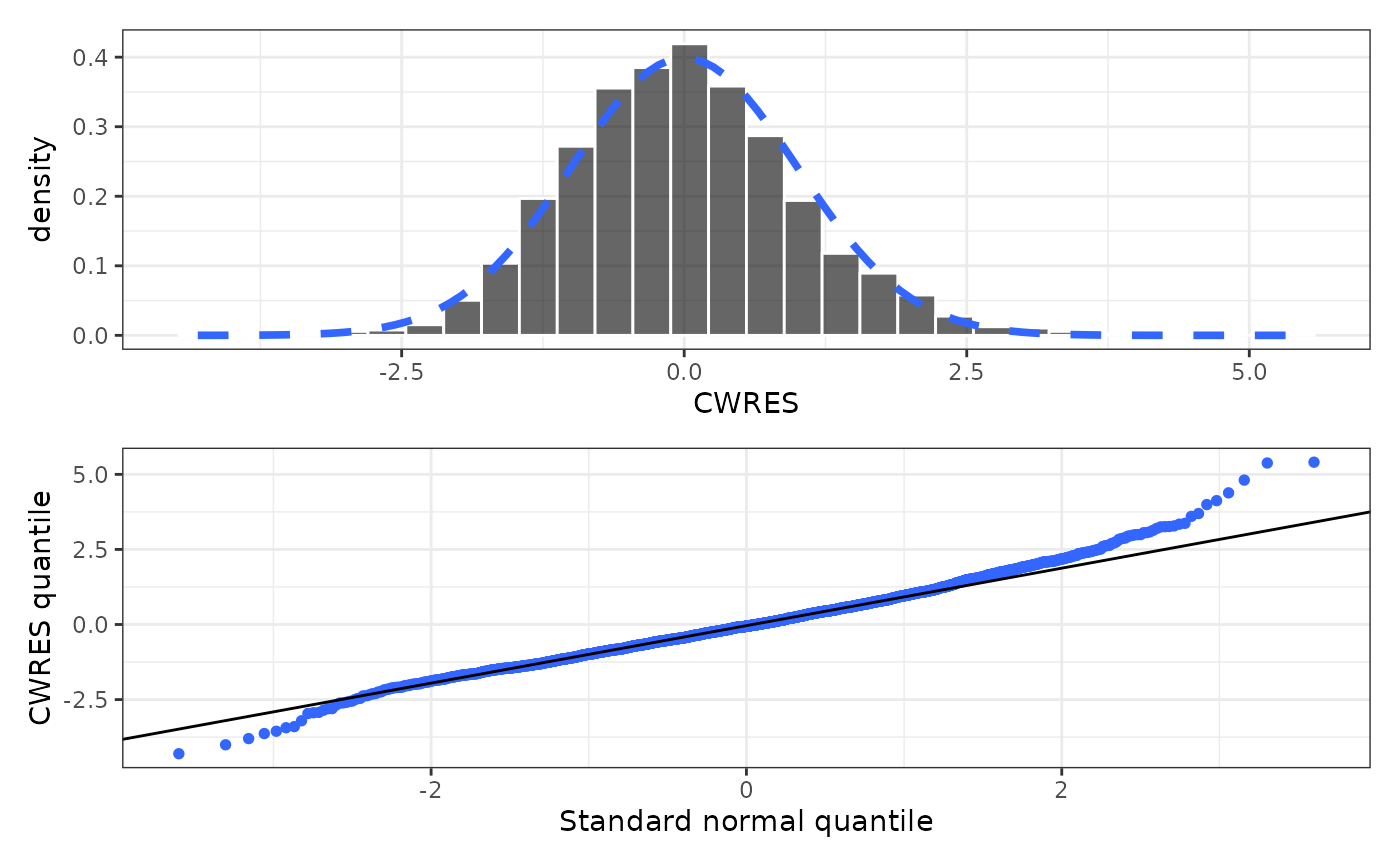
Create a display of residual histograms and quantile-quantile plots
Source:R/displays.R
res_hist_q.RdGet a single graphic showing NPDE or CWRES histogram and
quantile-quantile plots.
Arguments
- df
a data frame to plot.
- ncol
passed to
pm_grid().- tag_levels
passed to
patchwork::plot_annotation().
Value
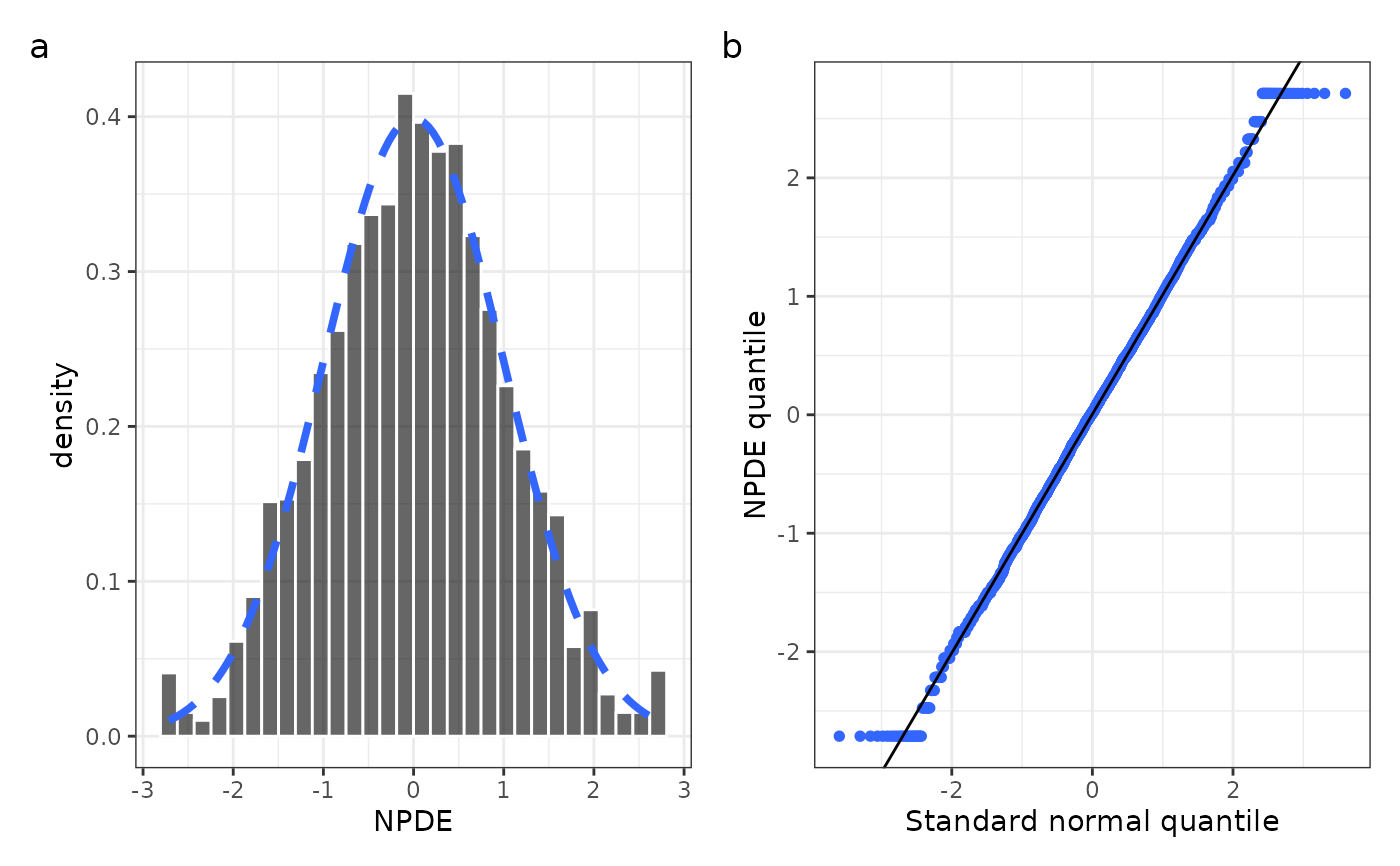
A single graphic is returned, with a NPDE or CWRES histogram and
quantile-quantile plot arranged in an object
using patchwork::plot_annotation().
Details
The default value for ncol (1) means the two plots will be arranged in a
single column, with the histogram on the top and quantile-quantile plot
on the bottom. Using ncol=2 will return an graphic with the plots
side by side.
Examples
data <- pmplots_data_obs()
npde_hist_q(data, tag_levels = "a")
#> `stat_bin()` using `bins = 30`. Pick better value `binwidth`.
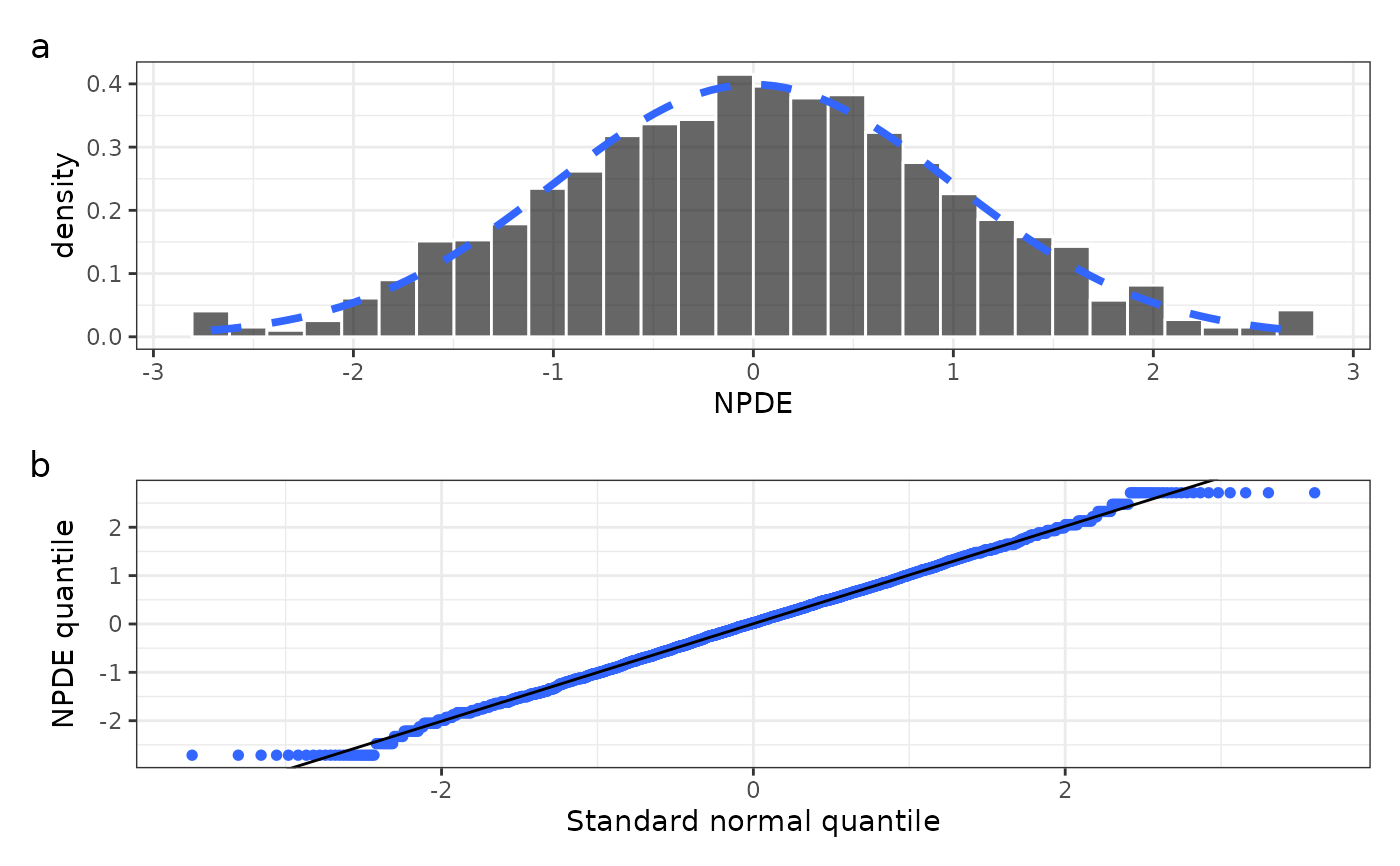 npde_hist_q(data, tag_levels = "a", ncol = 2)
#> `stat_bin()` using `bins = 30`. Pick better value `binwidth`.
npde_hist_q(data, tag_levels = "a", ncol = 2)
#> `stat_bin()` using `bins = 30`. Pick better value `binwidth`.
 cwres_hist_q(data)
#> `stat_bin()` using `bins = 30`. Pick better value `binwidth`.
cwres_hist_q(data)
#> `stat_bin()` using `bins = 30`. Pick better value `binwidth`.