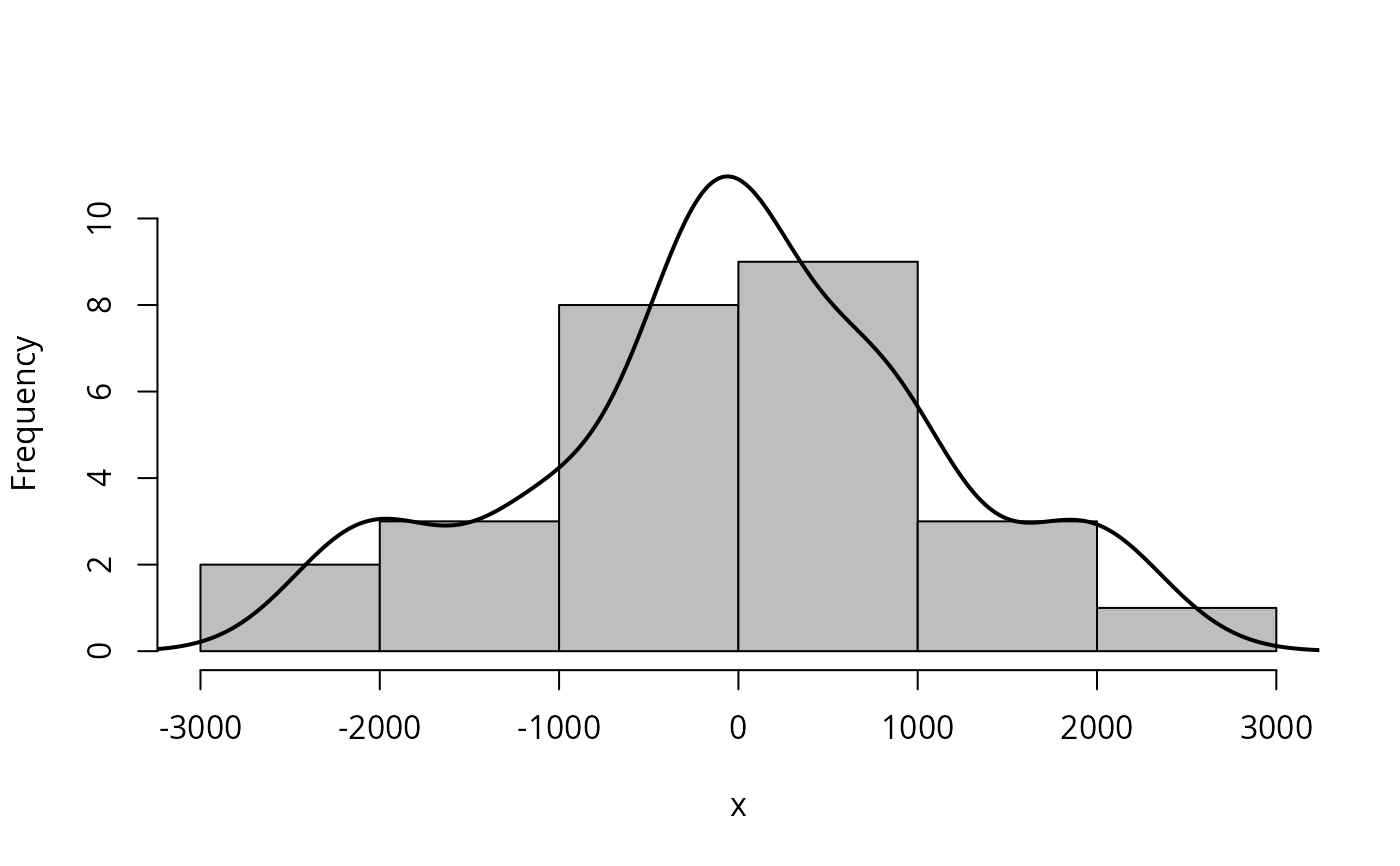
Histogram with a density curve
plotDensityHistogram.RdProduces a histogram for a vector of values and adds a density curve of the distribution.
Usage
plotDensityHistogram(
  x,
  prob = FALSE,
  col = "gray",
  main = "",
  linecol = "black",
  lwd = 2,
  adjust = 1,
  bw = "nrd0",
  kernel = "gaussian",
  ...
)
Arguments
- x
A vector of values.
- prob
If
FALSE, then counts are displayed in the histogram. IfTRUE, then the density is shown.- col
The color of the histogram bars.
- main
The title displayed for the plot.
- linecol
The color of the line in the plot.
- lwd
The width of the line in the plot.
- adjust
Passed to
density. A lower value makes the density plot smoother.- bw
Passed to
density.- kernel
Passed to
density.- ...
Other arguments passed to
hist.
Author
Salvatore Mangiafico, mangiafico@njaes.rutgers.edu