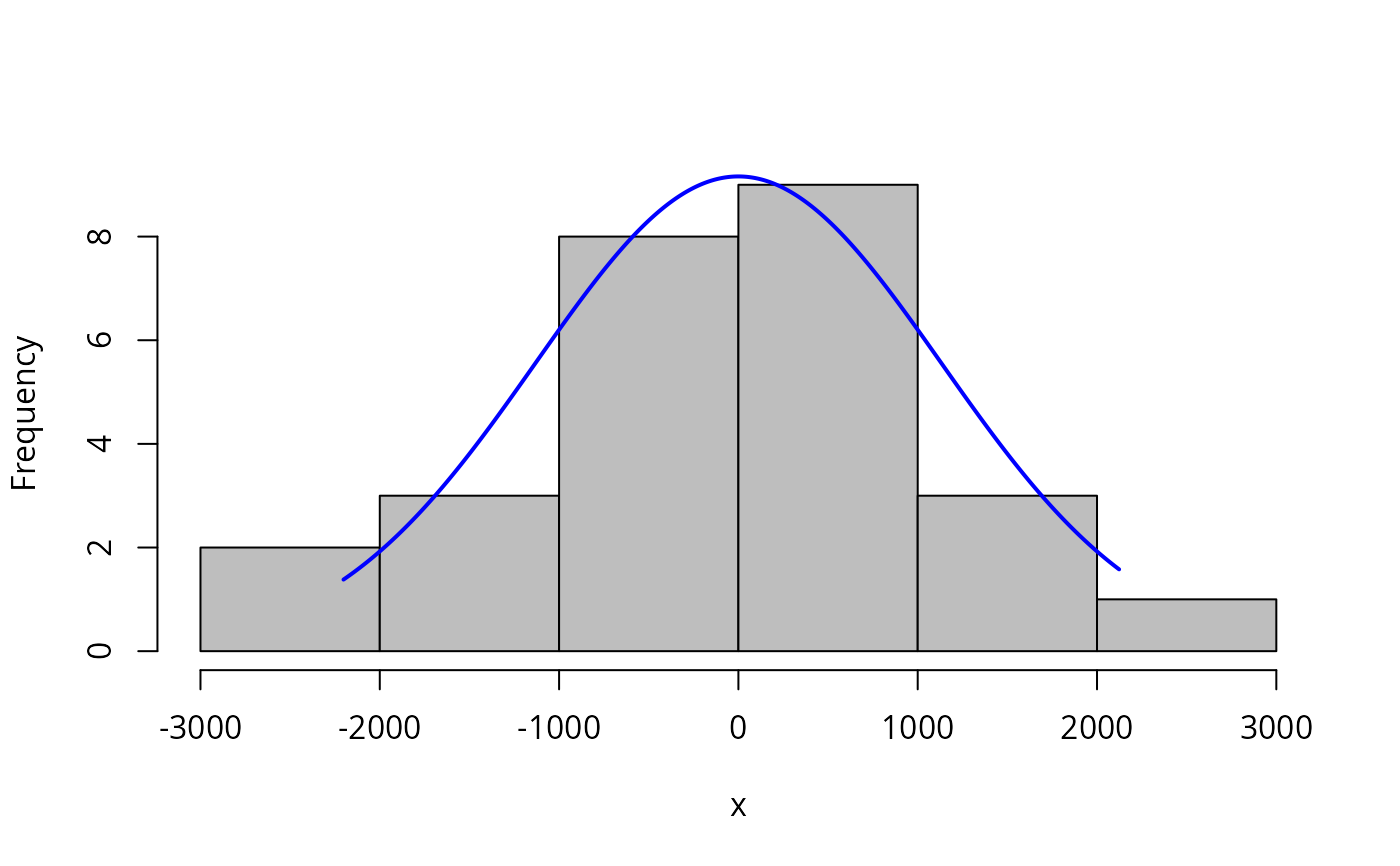
Histogram with a normal curve
plotNormalHistogram.RdProduces a histogram for a vector of values and adds a normal curve with the same mean and standard deviation. The plot can be used to quickly compare the distribution of data to a normal distribution.
Usage
plotNormalHistogram(
  x,
  prob = FALSE,
  col = "gray",
  main = "",
  linecol = "blue",
  lwd = 2,
  length = 1000,
  ...
)
Arguments
- x
A vector of values.
- prob
If
FALSE, then counts are displayed in the histogram. IfTRUE, then the density is shown.- col
The color of the histogram bars.
- main
The title displayed for the plot.
- linecol
The color of the line in the plot.
- lwd
The width of the line in the plot.
- length
The number of points in the line in the plot.
- ...
Other arguments passed to
hist.
Details
The function relies on the hist function. The normal curve
has the same mean and standard deviation as the values in the
vector.
Author
Salvatore Mangiafico, mangiafico@njaes.rutgers.edu