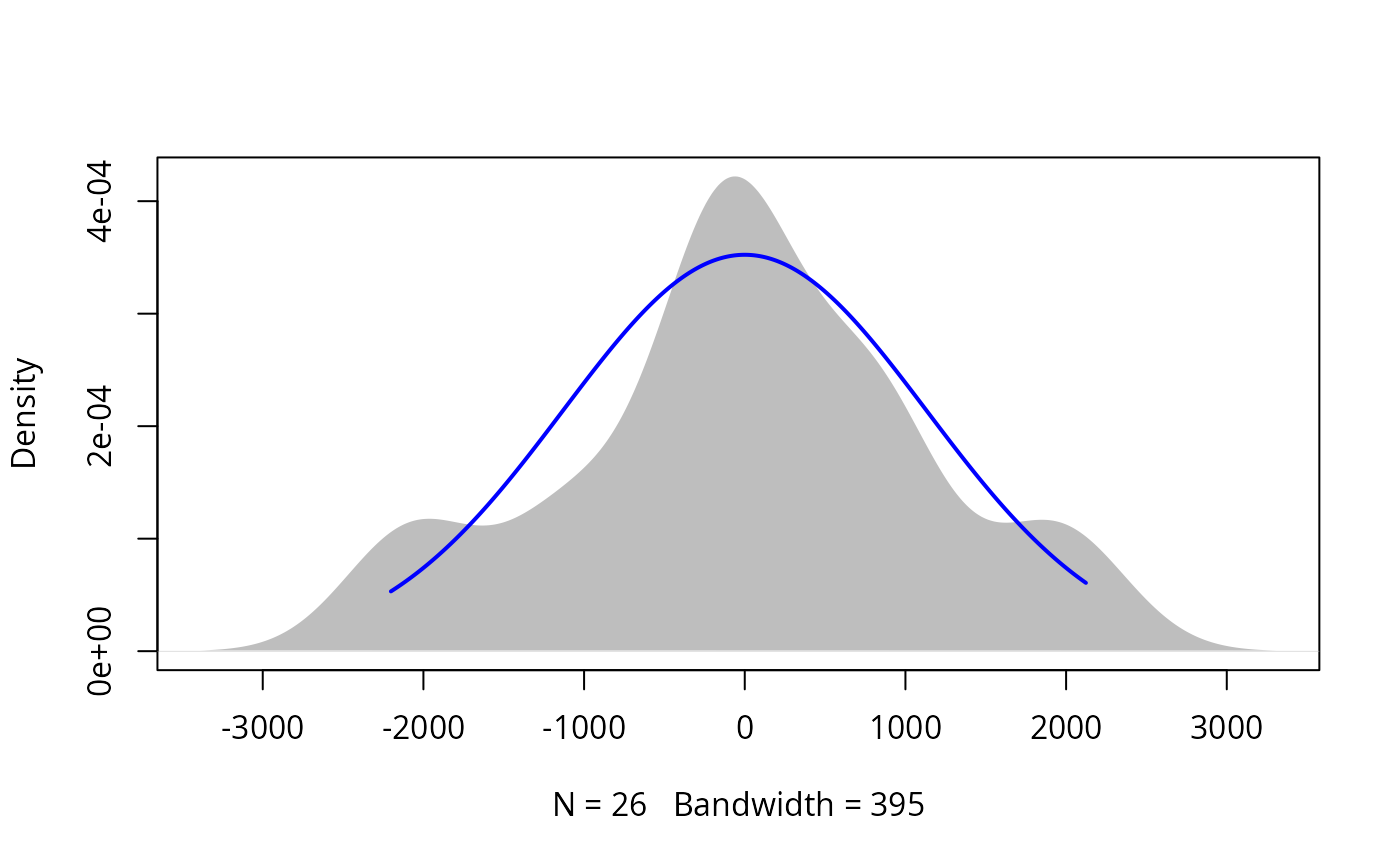
Density plot with a normal curve
plotNormalDensity.RdProduces a density plot for a vector of values and adds a normal curve with the same mean and standard deviation. The plot can be used to quickly compare the distribution of data to a normal distribution.
Usage
plotNormalDensity(
  x,
  col1 = "white",
  col2 = "gray",
  col3 = "blue",
  border = NA,
  main = "",
  lwd = 2,
  length = 1000,
  adjust = 1,
  bw = "nrd0",
  kernel = "gaussian",
  ...
)
Arguments
- x
A vector of values.
- col1
The color of the density plot. Usually not visible.
- col2
The color of the density polygon.
- col3
The color of the normal line.
- border
The color of the border around the density polygon.
- main
The title displayed for the plot.
- lwd
The width of the line in the plot.
- length
The number of points in the line in the plot.
- adjust
Passed to
density. A lower value makes the density plot smoother.- bw
Passed to
density.- kernel
Passed to
density.- ...
Other arguments passed to
plot.
Details
The function plots a polygon based on the density function.
The normal curve has the same mean and standard deviation as the
values in the vector.
Author
Salvatore Mangiafico, mangiafico@njaes.rutgers.edu