Repeat axis lines on facet panels
Stefan McKinnon Edwards sme@iysik.com
2025-09-17
Source:vignettes/facet-rep-labels.Rmd
facet-rep-labels.RmdDeprecation notice: The facet_rep_wrap
and facet_rep_lab have been deprecated in lemon v. 0.5.1.
Instead, we refer to the similar solutions in ggh4x’
facet_wrap2 and facet_grid2.
ggplot2 offers the fantastic option for displaying complex data in
forms of ‘many multiple’, i.e. the facets. From the example of
facet_grid:
p <- ggplot(mpg, aes(displ, cty)) + geom_point()
p + facet_grid(drv ~ cyl) + theme_bw()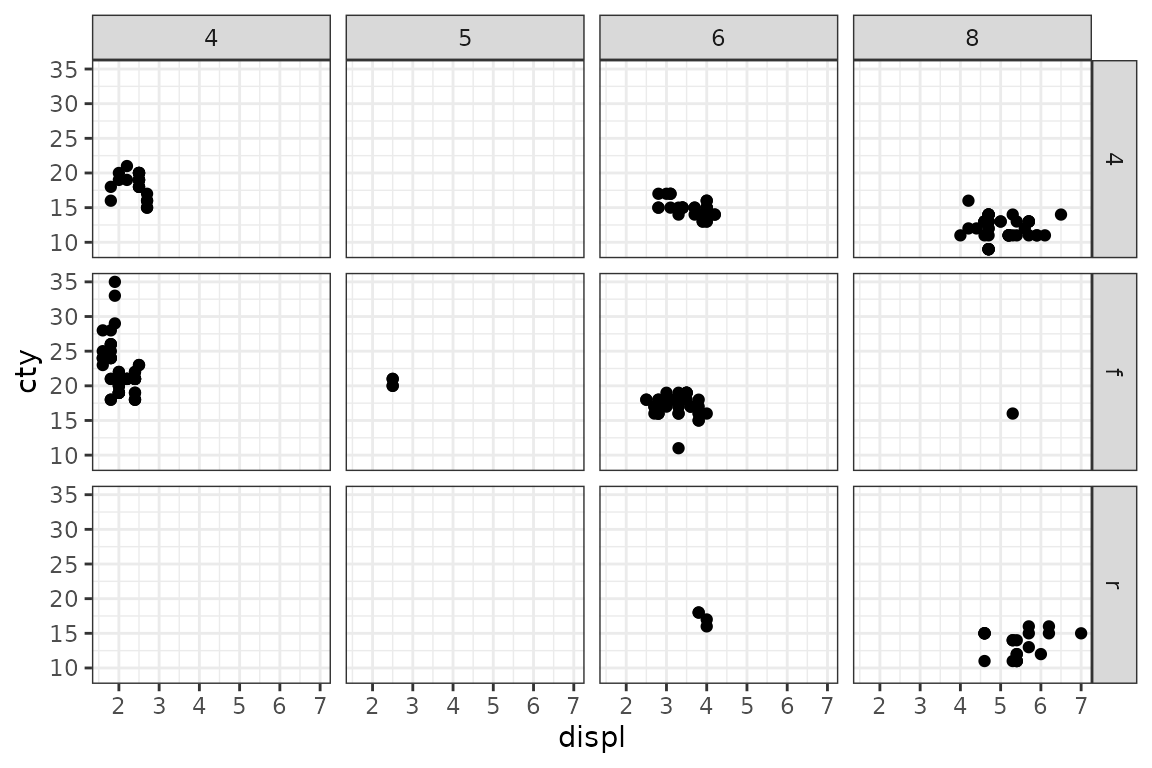
Faceting works quite well in its default form. When the panel’s borders are drawn, nothing lacks.
In the above example, the panel’s borders are drawn with the default
settings of theme_bw().
If we desire the axis lines, such as those given in this package, the distinction of the panels disappears.
library(lemon)
p <- p + coord_capped_cart(bottom='both', left='both') +
  theme_bw() + theme(panel.border=element_blank(), axis.line=element_line())
p + facet_grid(drv ~ cyl)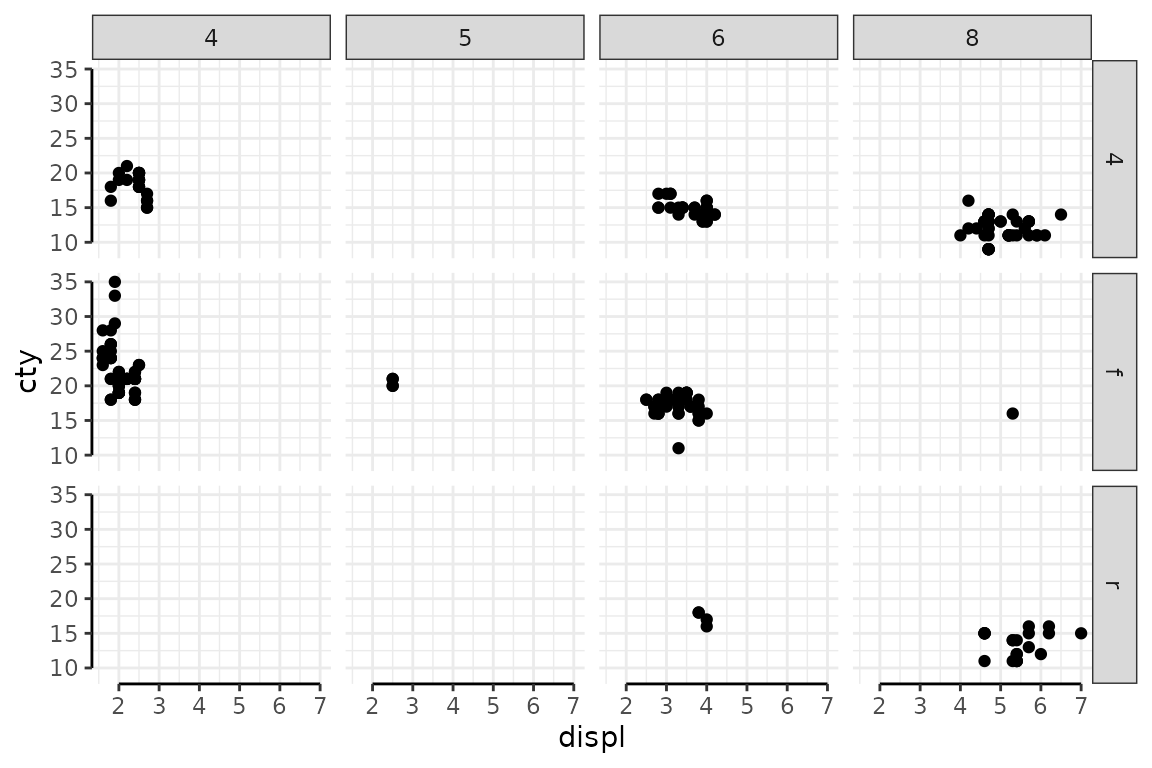
The optimised axis lines are gone from inner panels.
The above example is re-created below with both left- and bottom-axis lines repeated.
##
## Attaching package: 'ggh4x'
## The following objects are masked from 'package:lemon':
##
## geom_pointpath, GeomPointPath
p + facet_grid2(drv ~ cyl, axes = TRUE, remove_labels = TRUE) +
  coord_capped_cart(bottom='both', left='both') +
  theme_bw() + theme(panel.border=element_blank(), axis.line=element_line())
## Coordinate system already present.
## ℹ Adding new coordinate system, which will replace the existing one.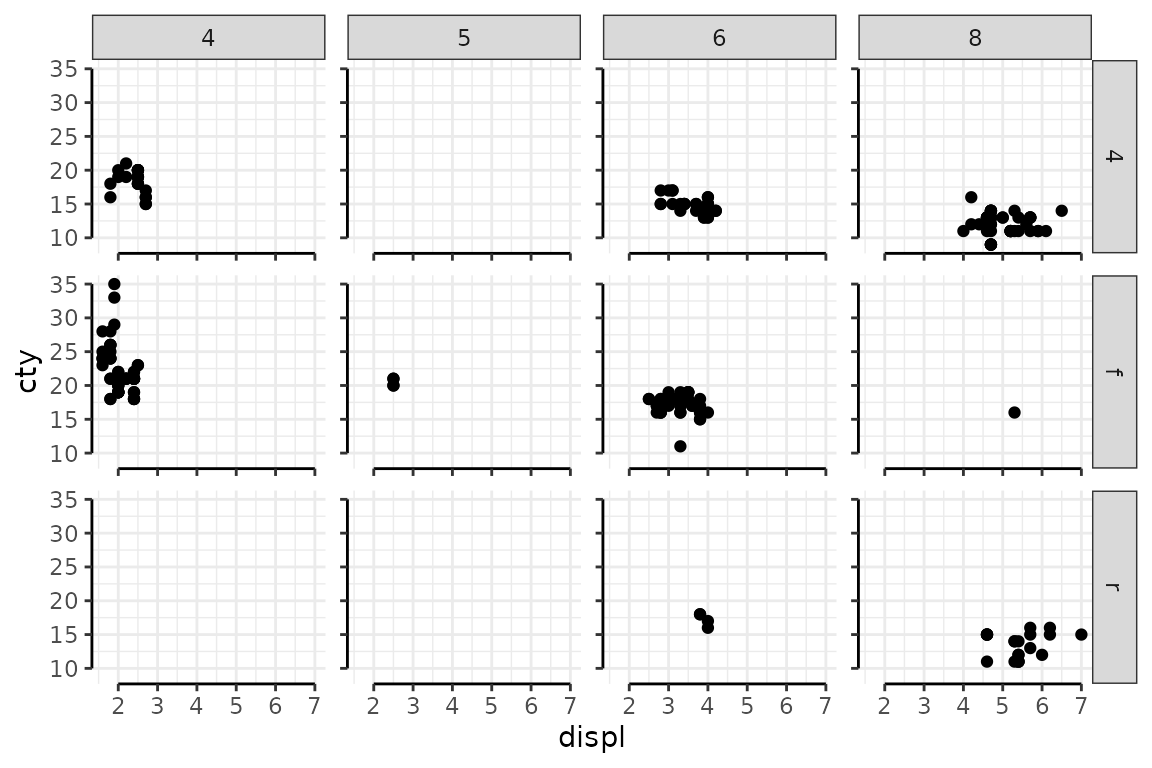
Axis lines are repeated across all panels by using
facet_rep_grid of the lemon package.
Keeping (some) labels
In the following example, we change the facet from a grid to being
wrapped on the interaction of drv and cyl,
and add free scaling on y-axis. facet_wrap would
normally print the y-axis tick labels for each panel, but still ignores
the x-axis.
p + facet_wrap(~ interaction(cyl, drv), scales='free_y') 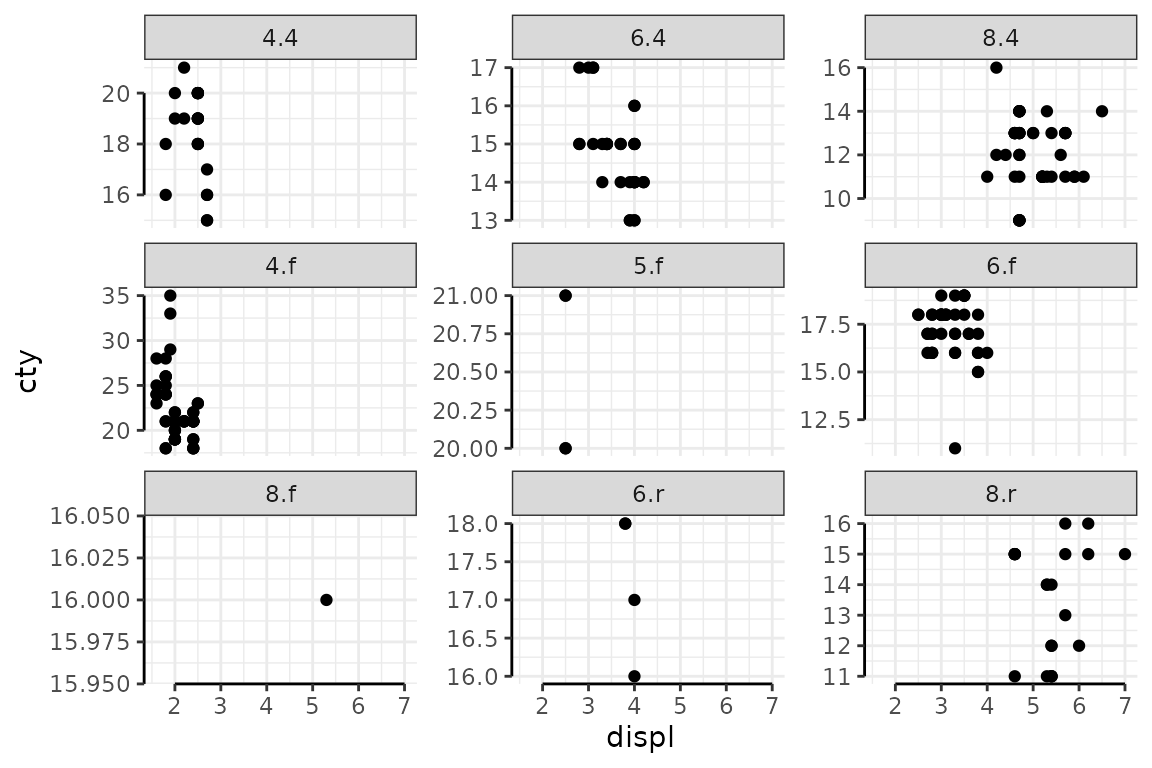
facet_wrap keeps y-axis label ticks with
scales='free_y'.
A work around by keeping both axes free scale, and fixing the x-axis
with either scale_x_continuous or limits in
cord_*, but the same x-axis tick labels are repeated. And
this is a bit tedious.
p + facet_wrap(~ interaction(cyl, drv), scales='free') +
  coord_capped_cart(bottom='both', left='both', xlim=c(2,7))
## Coordinate system already present.
## ℹ Adding new coordinate system, which will replace the existing one.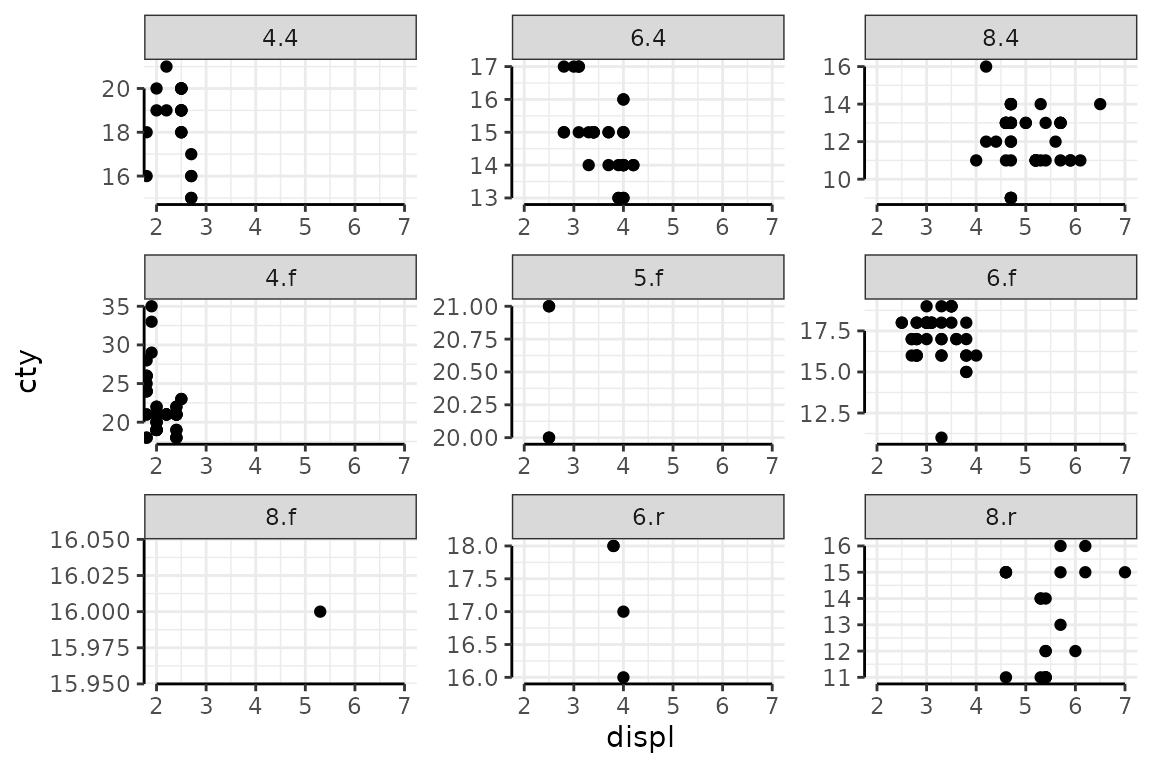
X-axis is entirely fixed, and the plot is littered with x-axis tick labels.
We can specify which inner labels to keep with
facet_rap2(..., remove_labels) . The default is to
keep all labels, but we can specify to remove all “x” or all
“y”.
p + facet_wrap2(~ interaction(cyl, drv), scales = 'free_y', axes = TRUE, remove_labels = "x")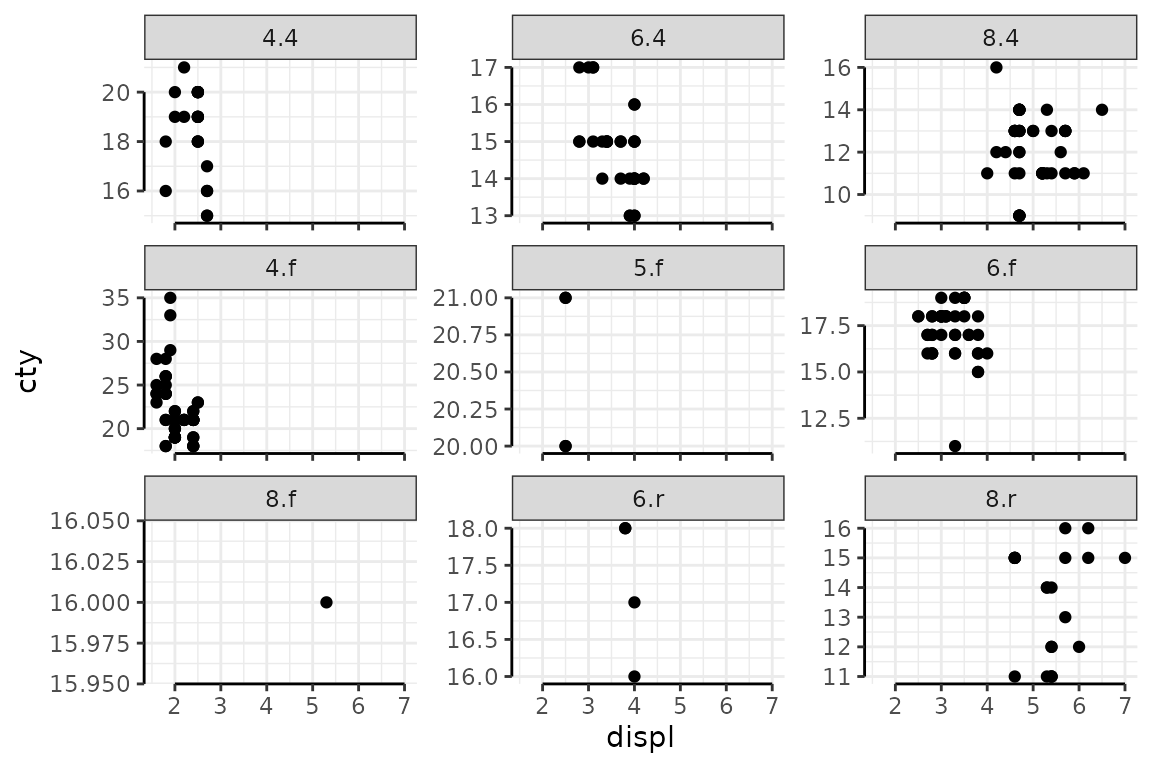
With repeat.tick.labels we are free to specify which sides
to keep.
Examples
There are many possibilities. Examples given below (but not executed), and they might not be pretty.
p + facet_wrap2(~ interaction(cyl, drv), scales = 'free_y', axes = TRUE, remove_labels = FALSE)
p + facet_wrap2(~ interaction(cyl, drv), scales = 'free_y', axes = TRUE, remove_labels = "y")
p + facet_wrap2(~ interaction(cyl, drv), scales = 'free_y', axes = TRUE, remove_labels = "x")
p + scale_x_continuous(sec.axis = dup_axis()) +
  facet_wrap2(~ interaction(cyl, drv), scales = 'free_y', axes = TRUE, remove_labels = FALSE)