Caps the axis lines to the outer ticks to e.g. indicate range of values.
Methods correspond to coord_cartesian and coord_flip
coord_capped_cart(
  xlim = NULL,
  ylim = NULL,
  expand = TRUE,
  top = waiver(),
  left = waiver(),
  bottom = waiver(),
  right = waiver(),
  gap = 0.01
)

coord_capped_flip(
  xlim = NULL,
  ylim = NULL,
  expand = TRUE,
  top = waiver(),
  left = waiver(),
  bottom = waiver(),
  right = waiver(),
  gap = 0.01
)

capped_horizontal(capped = c("both", "left", "right", "none"), gap = 0.01)

capped_vertical(capped = c("top", "bottom", "both", "none"), gap = 0.01)
Arguments
- xlim, ylim
Limits for the x and y axes.
- expand
If
TRUE, the default, adds a small expansion factor to the limits to ensure that data and axes don't overlap. IfFALSE, limits are taken exactly from the data orxlim/ylim.- top, left, bottom, right
Either a function returned from
capped_horizontalorbrackets_horizontal. If string, it is assumed to be shorthand forcapped_horizontal(capped)or similar for vertical.- gap
Both ends are always capped by this proportion. Usually a value between 0 and 1.
- capped
Which end to cap the line. Can be one of (where relevant):
both,none,left,right,top,bottom.
Details
This function is a simple override of coord_flex_cart
and coord_flex_flip,
which allows shorthand specification of what to cap.
NB! A panel-border is typically drawn on top such that it covers tick marks,
grid lines, and axis lines.
Many themes also do not draw axis lines.
To ensure the modified axis lines are visible, use
theme(panel.border=element_blank(), axis.lines=element_line()).
Examples
library(ggplot2)
# Notice how the axis lines of the following plot meet in the lower-left corner.
p <- ggplot(mtcars, aes(x = mpg)) + geom_dotplot() +
theme_bw() +
theme(panel.border=element_blank(), axis.line=element_line())
p
#> Bin width defaults to 1/30 of the range of the data. Pick better value with
#> `binwidth`.
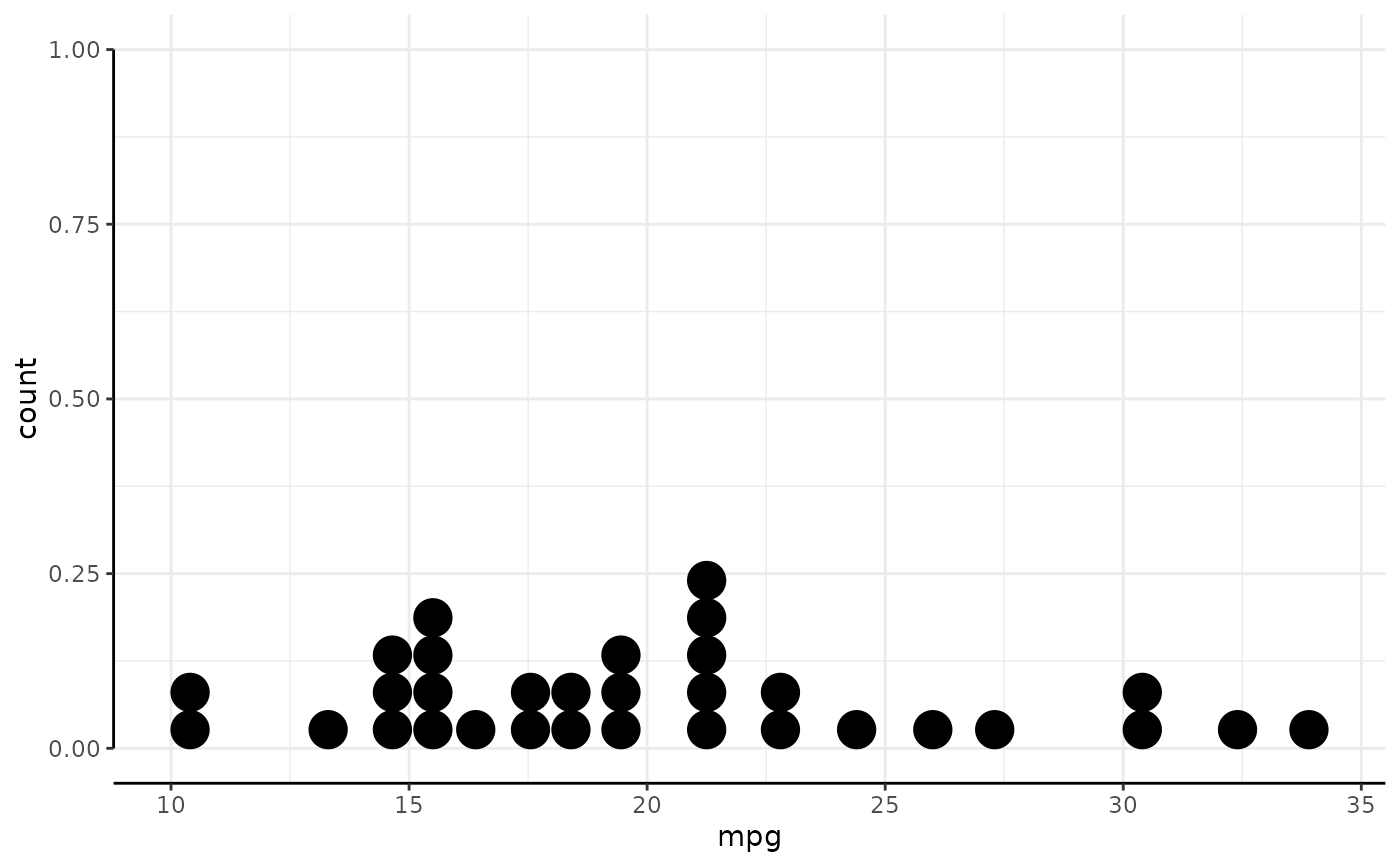
 # We can introduce a gap by capping the ends:
p + coord_capped_cart(bottom='none', left='none')
#> Bin width defaults to 1/30 of the range of the data. Pick better value with
#> `binwidth`.
# We can introduce a gap by capping the ends:
p + coord_capped_cart(bottom='none', left='none')
#> Bin width defaults to 1/30 of the range of the data. Pick better value with
#> `binwidth`.
 # The lower limit on the y-axis is 0. We can cap the line to this value.
# Notice how the x-axis line extends through the plot when we no long
# define its capping.
p + coord_capped_cart(left='both')
#> Bin width defaults to 1/30 of the range of the data. Pick better value with
#> `binwidth`.
# The lower limit on the y-axis is 0. We can cap the line to this value.
# Notice how the x-axis line extends through the plot when we no long
# define its capping.
p + coord_capped_cart(left='both')
#> Bin width defaults to 1/30 of the range of the data. Pick better value with
#> `binwidth`.
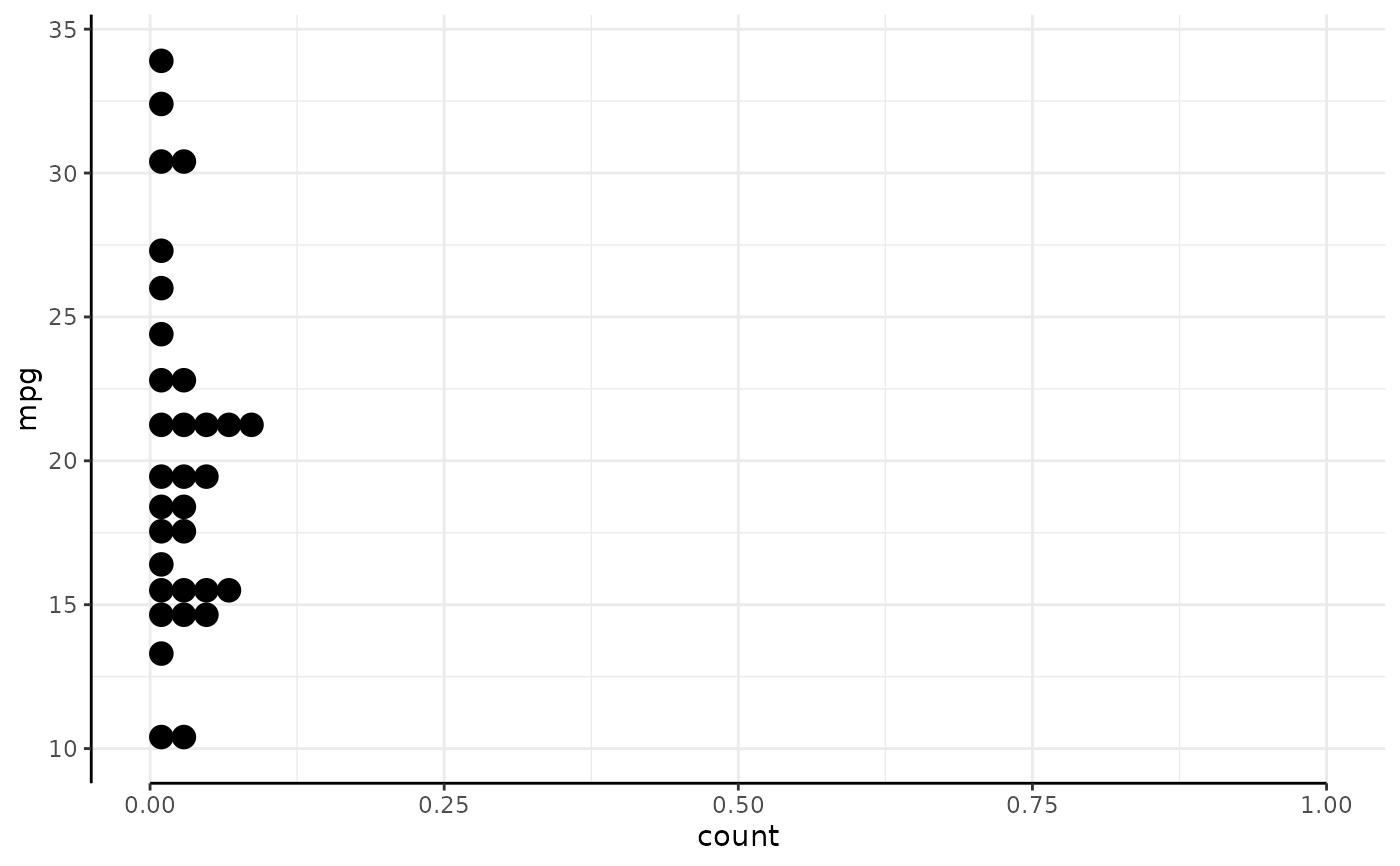
 # It it also works on the flipped.
p + coord_capped_flip(bottom='both')
#> Bin width defaults to 1/30 of the range of the data. Pick better value with
#> `binwidth`.
# It it also works on the flipped.
p + coord_capped_flip(bottom='both')
#> Bin width defaults to 1/30 of the range of the data. Pick better value with
#> `binwidth`.
 # And on secondary axis, in conjuction with brackets:
p +
scale_y_continuous(sec.axis = sec_axis(~.*100)) +
scale_x_continuous(sec.axis = sec_axis(~1/., name='Madness scale')) +
coord_capped_cart(bottom='none', left='none', right='both', top=brackets_horizontal())
#> Bin width defaults to 1/30 of the range of the data. Pick better value with
#> `binwidth`.
# And on secondary axis, in conjuction with brackets:
p +
scale_y_continuous(sec.axis = sec_axis(~.*100)) +
scale_x_continuous(sec.axis = sec_axis(~1/., name='Madness scale')) +
coord_capped_cart(bottom='none', left='none', right='both', top=brackets_horizontal())
#> Bin width defaults to 1/30 of the range of the data. Pick better value with
#> `binwidth`.
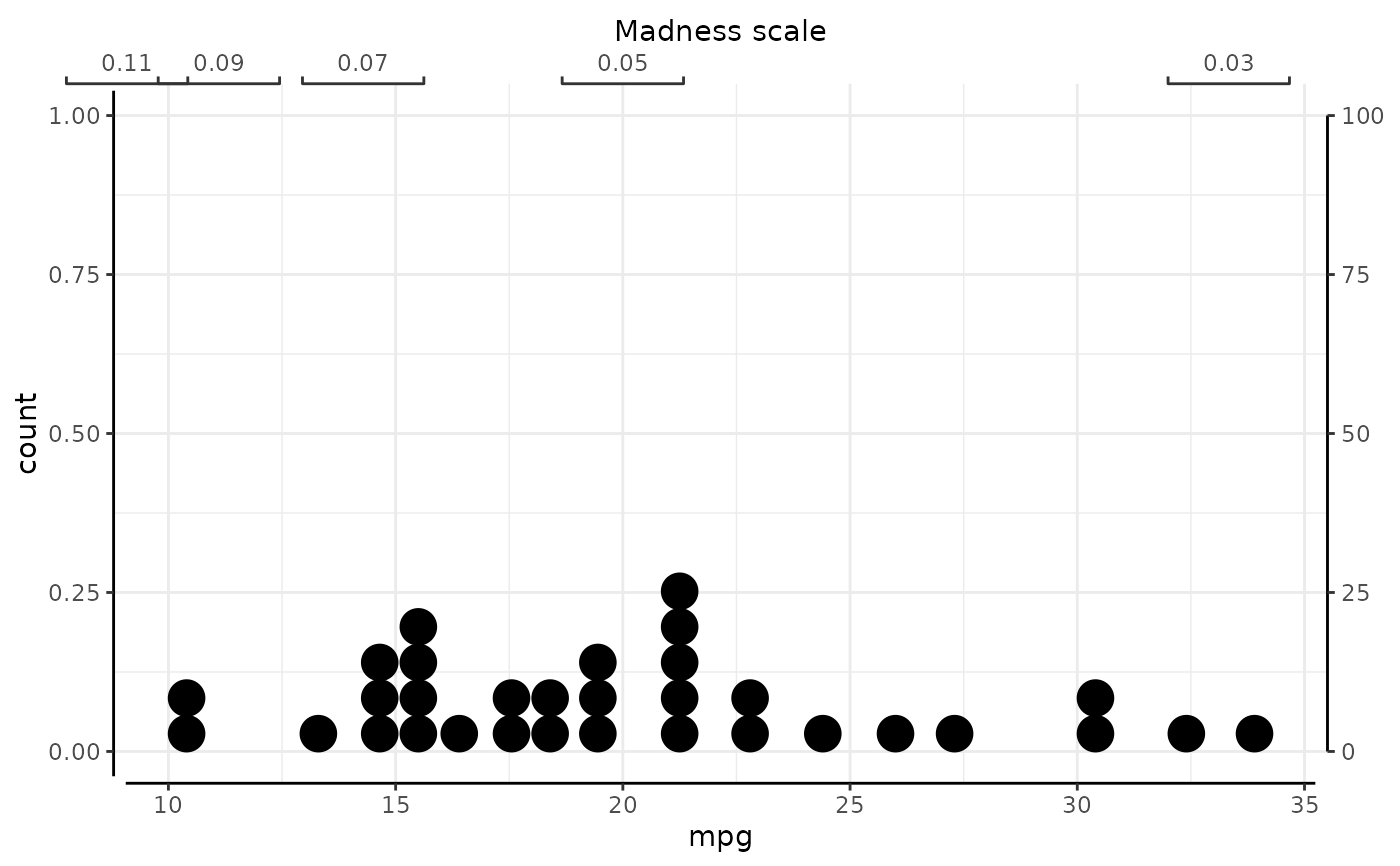 # Although we cannot recommend the above madness.