Annotations on the axis
Arguments
- label
Text to print
- y, x
Position of the annotation.
- side
left or right, or top or bottom side to print annotation
- print_label, print_value, print_both
Logical; what to show on annotation. Label and/or value.
print_bothis shortcut for setting bothprint_labelandprint_value. When both is TRUE, uses argumentsepto separate the label and value.- parsed
Logical (default
FALSE), whenTRUE, uses mathplot for outputting expressions. See section "Showing values".- ...
Style settings for label and tick: colour, hjust, vjust, size, fontface, family, rot. When
waiver()(default), the relevant theme element is used.
Showing values
See plotmath for using mathematical expressions.
The function uses a simple replacement strategy where the literal strings
.(y) and .(val) are replaced by the value after round of to
a number of digits, as given by argument digits.
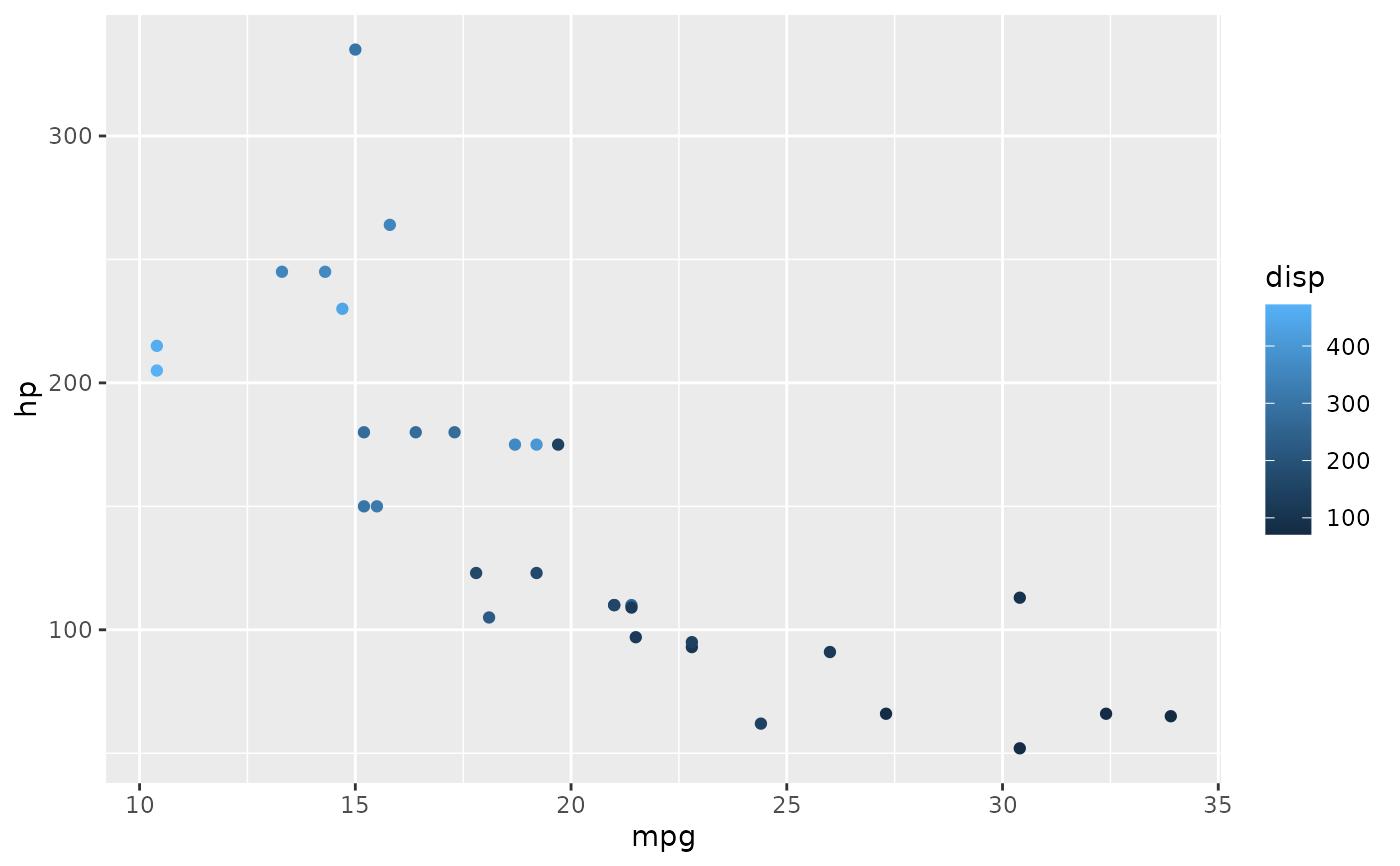
Examples
library(ggplot2)
p <- ggplot(mtcars, aes(mpg, hp, colour=disp)) + geom_point()
l <- p + annotate_y_axis('mark at', y=200, tick=TRUE)
l
 (l + annotate_x_axis('| good economy ->', x=25, print_value=FALSE, hjust=0, tick=TRUE))
 l + annotate_y_axis("x^2 == .(y)", y=150, parsed=FALSE, tick=FALSE) +
annotate_y_axis("x^2 + bar(x) == .(y)", y=mean(mtcars$hp), parsed=TRUE, tick=TRUE)
l + annotate_y_axis("x^2 == .(y)", y=150, parsed=FALSE, tick=FALSE) +
annotate_y_axis("x^2 + bar(x) == .(y)", y=mean(mtcars$hp), parsed=TRUE, tick=TRUE)
 l + annotate_y_axis("bar(x) == .(y)", y = mean(mtcars$hp), parsed=TRUE, tick=FALSE)
 # use double equal signs, or the output becomes '=(...)' for some reason.
l + annotate_y_axis('this is midway', y=sum(range(mtcars$hp))/2, print_value = FALSE, side='left')
# use double equal signs, or the output becomes '=(...)' for some reason.
l + annotate_y_axis('this is midway', y=sum(range(mtcars$hp))/2, print_value = FALSE, side='left')
 # work around if an axis only contains parsed expressions
p + annotate_y_axis("bar(x) == .(y)", y = mean(mtcars$hp), parsed=TRUE, tick=FALSE) +
annotate_y_axis("some long string", y=100, tick=FALSE, print_value=FALSE, colour=NA)
# work around if an axis only contains parsed expressions
p + annotate_y_axis("bar(x) == .(y)", y = mean(mtcars$hp), parsed=TRUE, tick=FALSE) +
annotate_y_axis("some long string", y=100, tick=FALSE, print_value=FALSE, colour=NA)
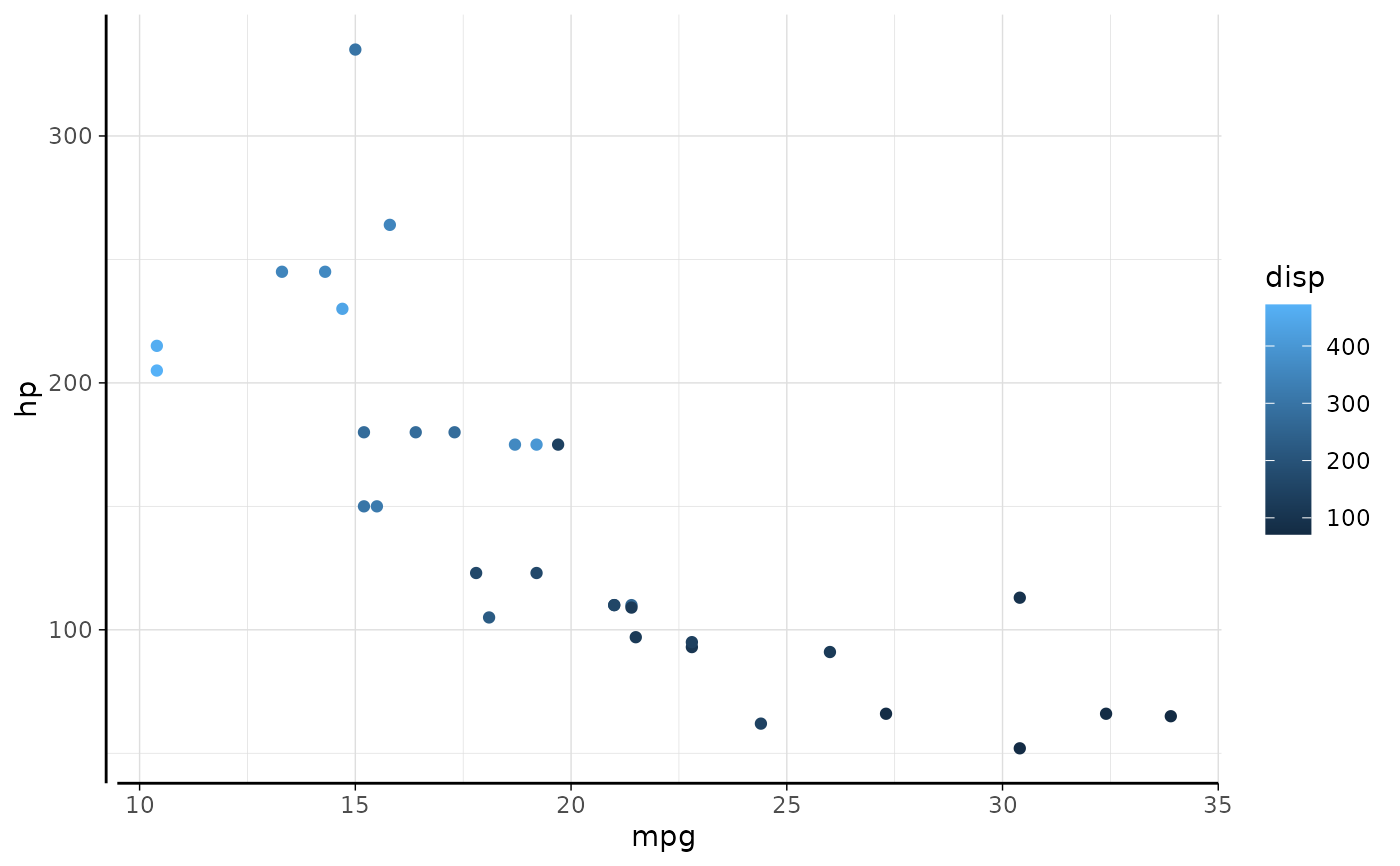
 # Works together with other functions
p <- p + theme_light() + theme(panel.border=element_blank(),
axis.line = element_line(),
axis.ticks = element_line(colour='black'))
p + coord_capped_cart(bottom='right') +
annotate_y_axis('More than I\ncan afford', y=125,
print_value=FALSE, tick=TRUE)
# Works together with other functions
p <- p + theme_light() + theme(panel.border=element_blank(),
axis.line = element_line(),
axis.ticks = element_line(colour='black'))
p + coord_capped_cart(bottom='right') +
annotate_y_axis('More than I\ncan afford', y=125,
print_value=FALSE, tick=TRUE)