
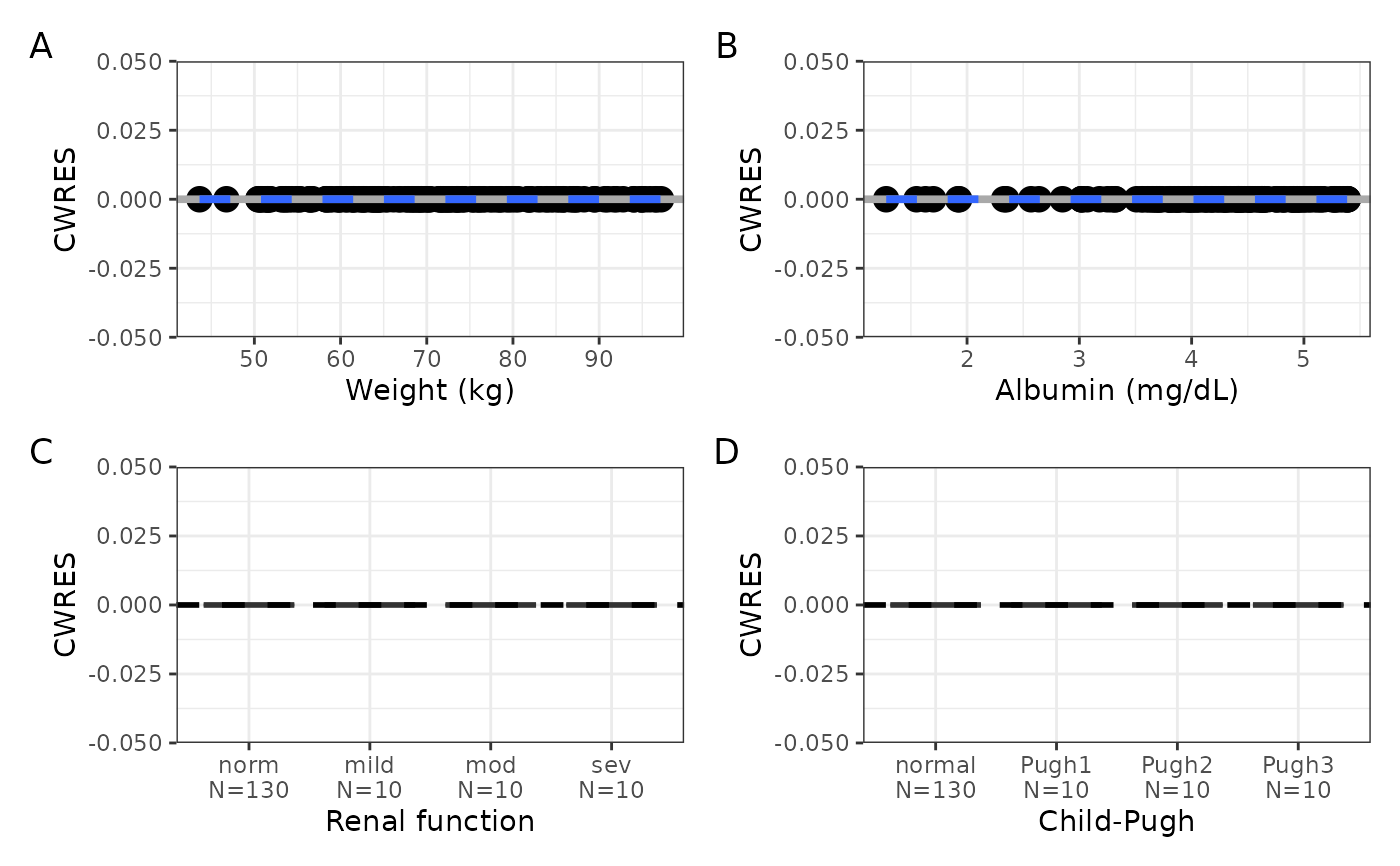
Get a single graphic of CWRES versus continuous and / or categorical
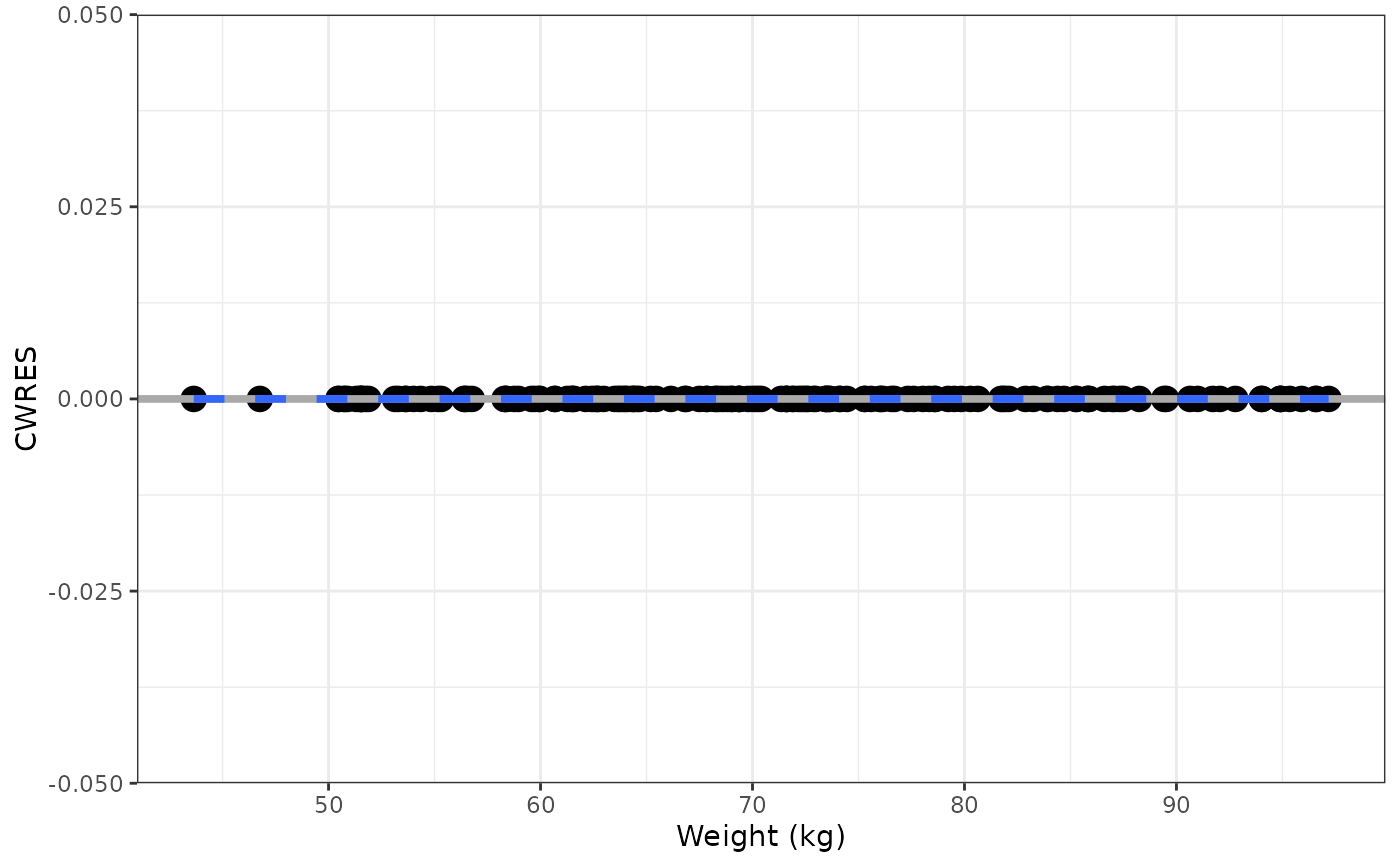
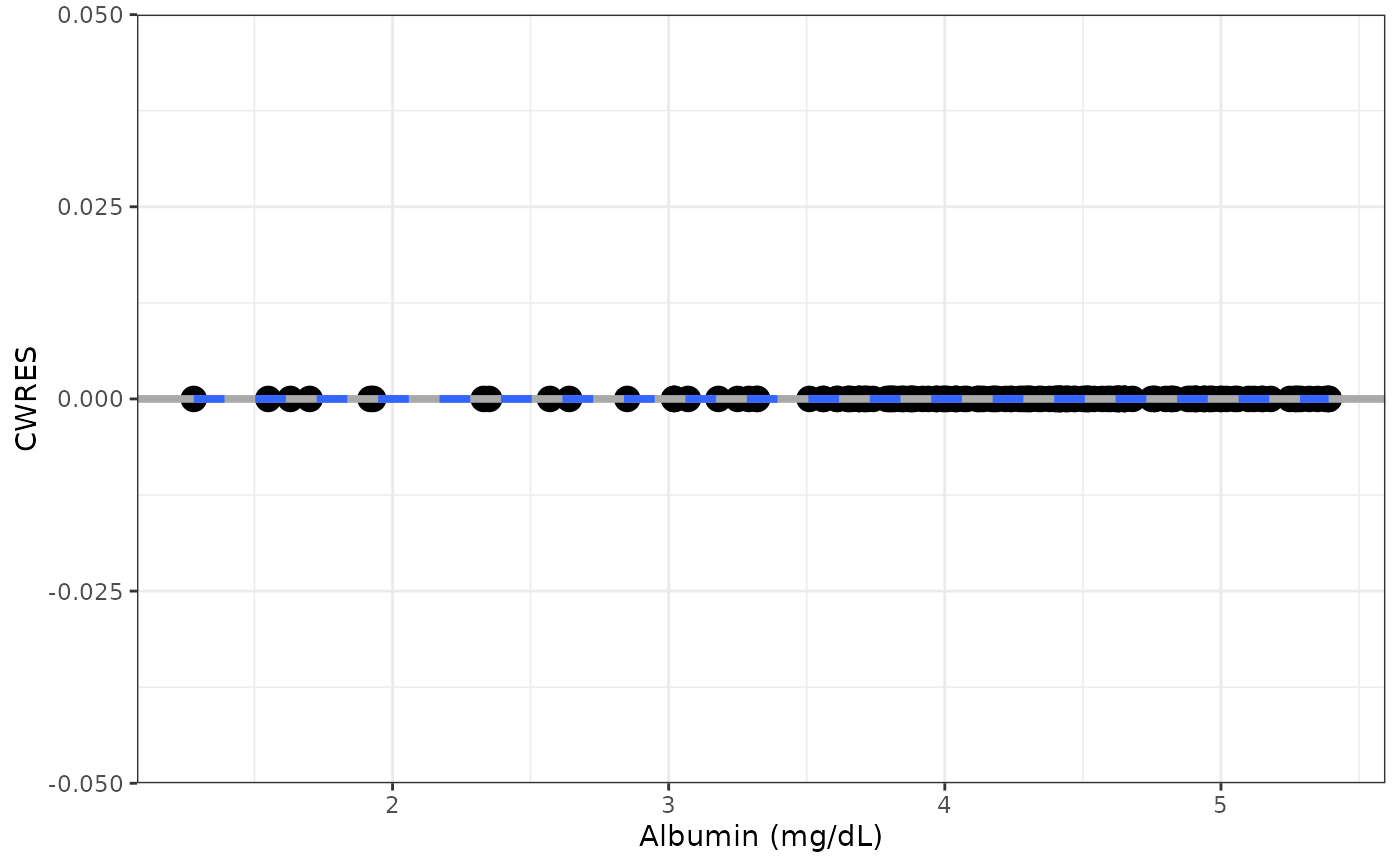
covariates (cwres_covariate()) or get a list that can be arranged by
the user (cwres_covariate_list()). See cwres_panel() for other CWRES
diagnostic displays.
Usage
cwres_covariate(
  df,
  x,
  ncol = 2,
  tag_levels = NULL,
  byrow = NULL,
  points = NULL
)

cwres_covariate_list(df, x, points = NULL)
Arguments
- df
a data frame to plot.
- x
character
col//titlefor covariates to plot on x-axis; seecol_label().- ncol
passed to
pm_grid().- tag_levels
passed to
patchwork::plot_annotation().- byrow
passed to
pm_grid().- points
passed to
boxwork()when plotting categorical covariates.
Value
cwres_covariate() returns single graphic of scatter plot diagnostics
as a patchwork object that has been arranged using pm_grid() and
cwres_covariate_list() returns the same component plots unarranged in a
list.
Details
Pass ncol = NULL or another non-numeric value to bypass arranging plots
coming from cwres_covariate().
Examples
data <- pmplots_data_id()
cont <- c("WT//Weight (kg)", "ALB//Albumin (mg/dL)")
cats <- c("RF//Renal function", "CPc//Child-Pugh")
cwres_covariate(data, x = c(cont, cats), tag_levels = "A")
#> Creating CWRES column from CWRESI
#> Creating CWRES column from CWRESI
#> Creating CWRES column from CWRESI
#> Creating CWRES column from CWRESI
#> `geom_smooth()` using formula = 'y ~ x'
#> `geom_smooth()` using formula = 'y ~ x'
 cwres_covariate_list(data, x = cont)
#> Creating CWRES column from CWRESI
#> Creating CWRES column from CWRESI
#> $WT
#> `geom_smooth()` using formula = 'y ~ x'
cwres_covariate_list(data, x = cont)
#> Creating CWRES column from CWRESI
#> Creating CWRES column from CWRESI
#> $WT
#> `geom_smooth()` using formula = 'y ~ x'
 #>
#> $ALB
#> `geom_smooth()` using formula = 'y ~ x'
#>
#> $ALB
#> `geom_smooth()` using formula = 'y ~ x'
 #>
#> attr(,"class")
#> [1] "pm_display" "list"
#>
#> attr(,"class")
#> [1] "pm_display" "list"