This function is a wrapper to GGally::ggpairs() with customized
functions for upper and lower off-diagonal panels. See details for help
on customizing some aspects of the off-diagonal plots.
Usage
pairs_plot(
  x,
  y,
  bins = 15,
  unit_break = TRUE,
  alpha = opts$histogram.alpha,
  fill = opts$histogram.fill,
  col = opts$histogram.col,
  label_fun = label_parse_label,
  lower_plot = pairs_lower_plot,
  upper_fun = NULL,
  lower_fun = NULL,
  diag = c("barDiag", "densityDiag", "blankDiag"),
  ...
)

eta_pairs(x, etas, ...)
Arguments
- x
plotting data.frame
- y
character
col//labelfor pairs data; seecol_label()- bins
passed to
ggplot2::geom_histogram()to render the diagonal- unit_break
if
TRUE(the default), a newline is inserted between the label text and a trailing parenthetical unit (e.g.,"Weight (kg)"becomes"Weight\n(kg)").- alpha
passed to
ggplot2::geom_histogram()orggplot2::geom_density()to render the diagonal- fill
passed to
ggplot2::geom_histogram()orggplot2::geom_density()to render the diagonal- col
passed to
ggplot2::geom_histogram()orggplot2::geom_density()to render the diagonal- label_fun
labeller function that gets passed to
GGally::ggpairs(); the default is based onparse_label()and thus allows latex expressions in the label (see examples)- lower_plot
function to create plots in the lower triangle; the should accept a single argument (a
ggobject) and return aggobject; seepairs_lower_plot()as an example; you probably want to use this argument (rather thanlower_fun) if you want to customize how the plots on the lower triangle look- upper_fun
function to use for
upperargument- lower_fun
function to use for
lowerargument; if you want to customize how the plots on the lower triangle look, you probably want to use thelower_plotargument- diag
how to render data on the diagonal; options are limited to those accepted by
GGally::ggpairs()forcontinuousdata (see that help topic)- ...
passed to
GGally::ggpairs()- etas
character
col//labelfor pairs data; seecol_label()
Details
This function requires the GGally package to be installed.
When the length of etas is one, arguments are passed to eta_hist() and
that result is returned.
Use the options object to modify aspects of the smoother line:
smooth.col, smooth.lwd, smooth.lty, smooth.method. Also, use the
options object to control aspects of the points: scatter.col,
scatter.size.
Examples
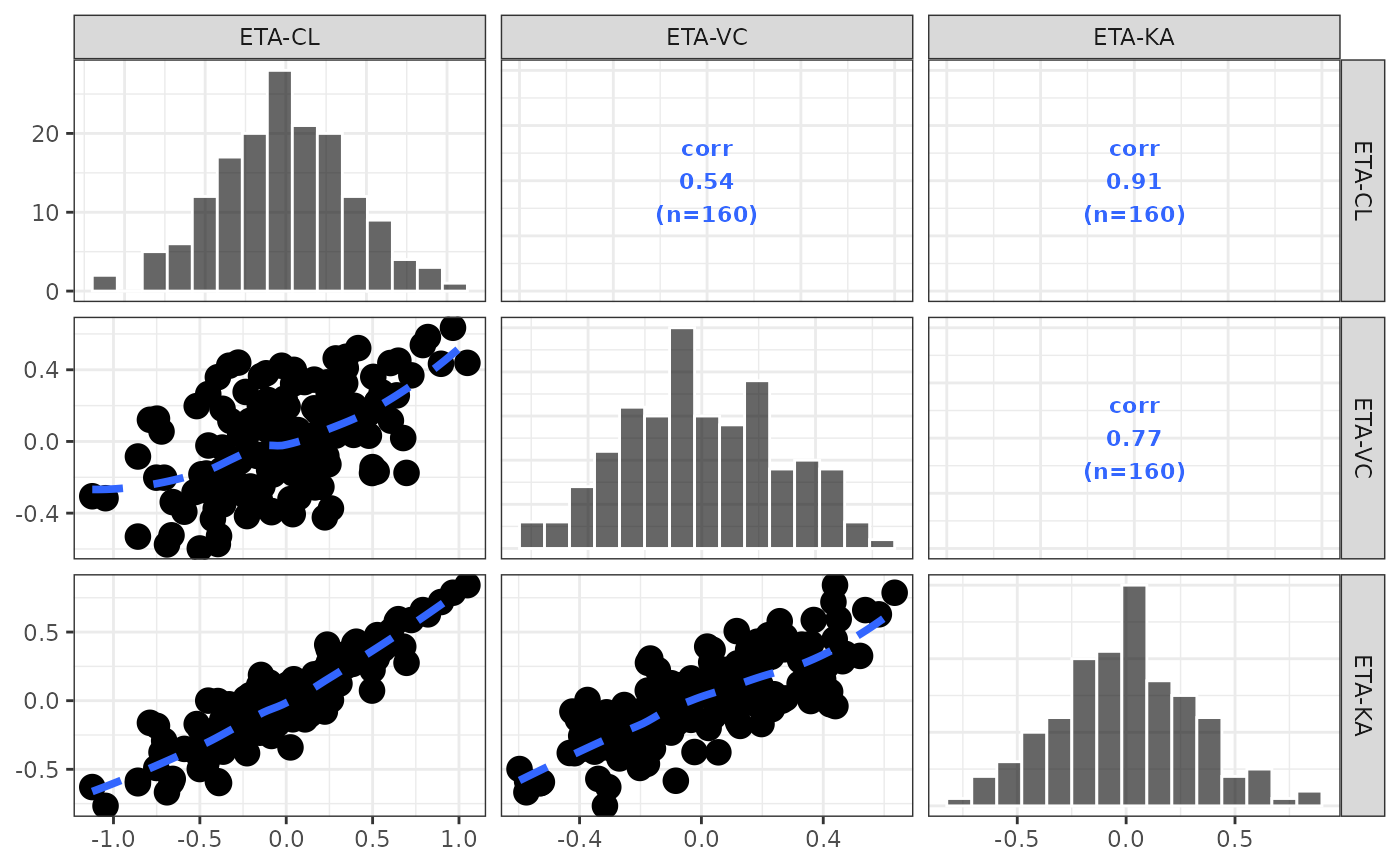
id <- pmplots_data_id()
etas <- c("ETA1//ETA-CL", "ETA2//ETA-VC", "ETA3//ETA-KA")
eta_pairs(id,etas)
#> `geom_smooth()` using formula = 'y ~ x'
#> `geom_smooth()` using formula = 'y ~ x'
#> `geom_smooth()` using formula = 'y ~ x'
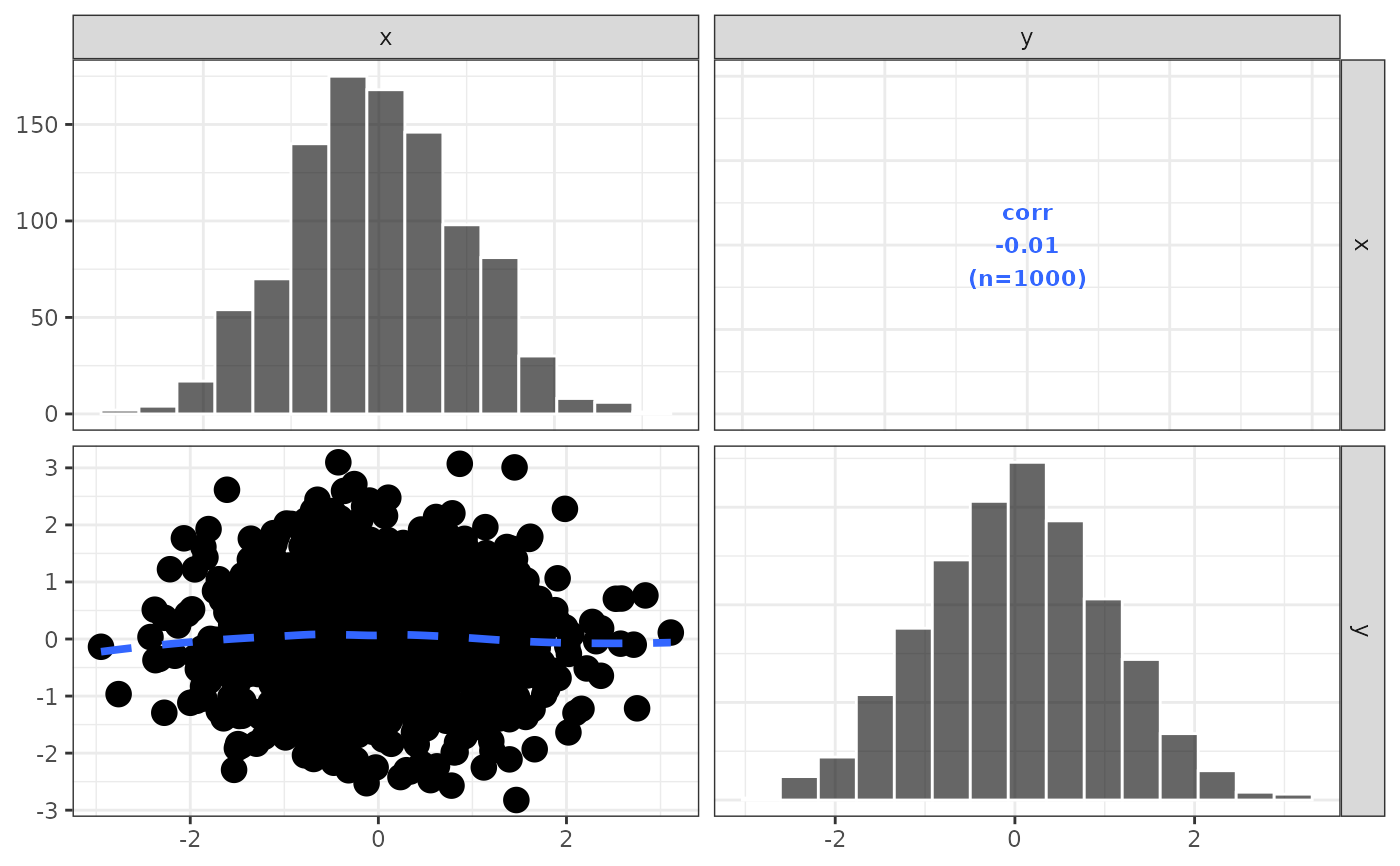
 df <- data.frame(x = rnorm(1000), y = rnorm(1000))
pairs_plot(df, c("x", "y"))
#> `geom_smooth()` using formula = 'y ~ x'
df <- data.frame(x = rnorm(1000), y = rnorm(1000))
pairs_plot(df, c("x", "y"))
#> `geom_smooth()` using formula = 'y ~ x'
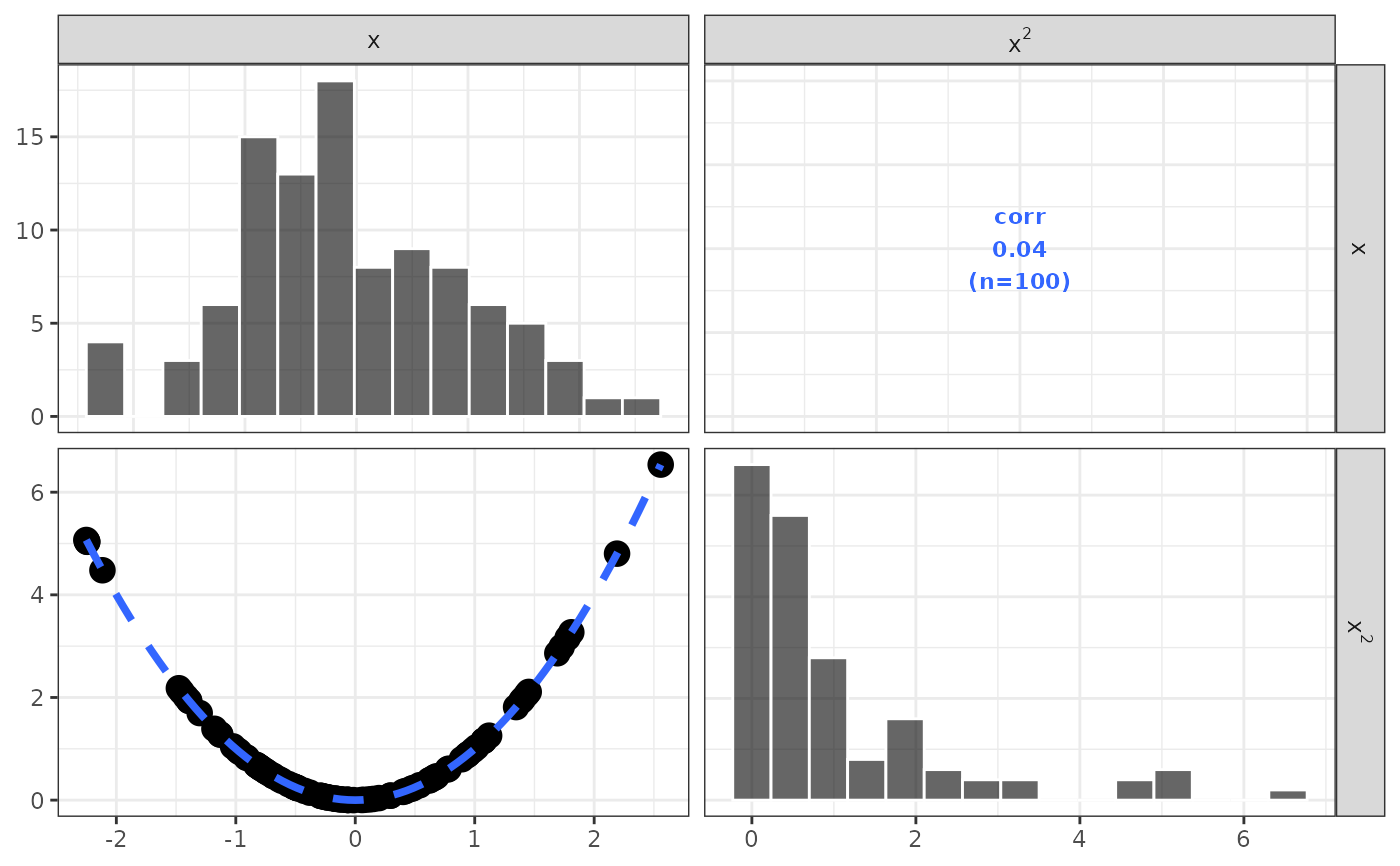
 df2 <- dplyr::tibble(x = rnorm(100), y = x^2)
pairs_plot(df2, c("x//x", "y//x$^2$"))
#> Loading required namespace: latex2exp
#> `geom_smooth()` using formula = 'y ~ x'
df2 <- dplyr::tibble(x = rnorm(100), y = x^2)
pairs_plot(df2, c("x//x", "y//x$^2$"))
#> Loading required namespace: latex2exp
#> `geom_smooth()` using formula = 'y ~ x'