Adding arrows to a swimmers plot
swimmer_arrows.RdThis function allows you to add arrows to a swimmers plot created with
swimmer_plot
swimmer_arrows(
  df_arrows,
  id = "id",
  arrow_start = "end",
  cont = NULL,
  adj.y = 0,
  name_col = NULL,
  arrow_positions = c(0.1, 1),
  angle = 30,
  length = 0.1,
  type = "closed",
  ...
)
Arguments
- df_arrows
a data frame
- id
column name for id, default is 'id'
- arrow_start
column name with the arrow locations default is "end"
- cont
a column name including an indicator of which ids have an arrow (NA is no arrow); when NULL will use all use all of df_arrows
- adj.y
amount to adjust the line within the box vertically (default is 0, line is in the centre of each bar)
- name_col
a column name to map the arrow colour
- arrow_positions
a vector of the distance from the arrow start to end, default is c(0.1,1)
- angle
the angle of the arrow head in degrees (smaller numbers produce narrower, pointier arrows). Essentially describes the width of the arrow head. Default is 30
- length
a unit specifying the length of the arrow head (from tip to base in inches (default is 0.1)'
- type
one of "open" or "closed" indicating whether the arrow head should be a closed triangle. Default is 'closed'
- ...
additional geom_segment() arguments
Value
a swimmer plot with arrows
See also
Examples
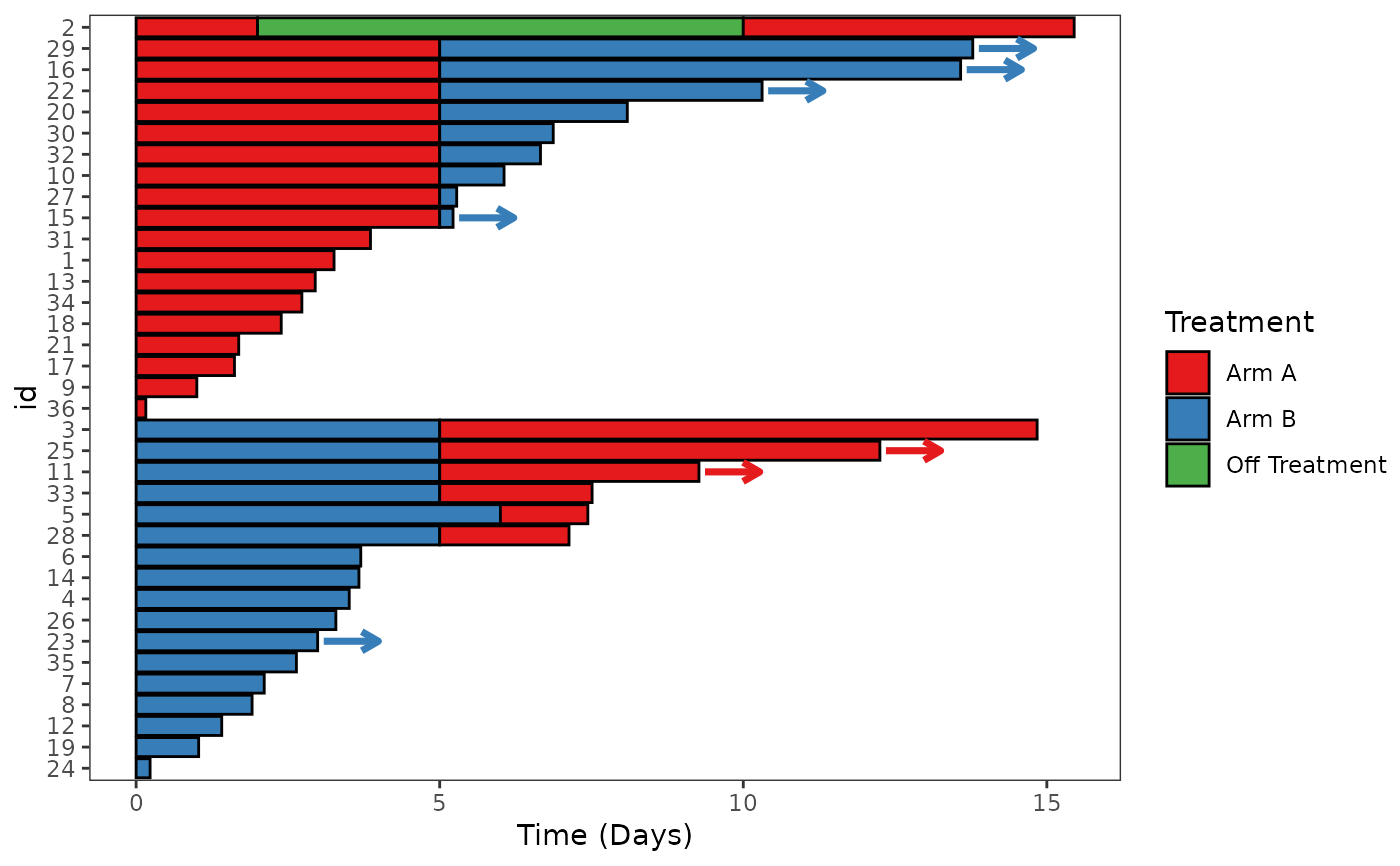
#Mapping the arrows to the bars
swim_plot <-
swimmer_plot(df=ClinicalTrial.Arm,id='id',end='End_trt',name_fill='Arm',col="black",id_order
= 'Arm')
swim_plot_with_arrows <- swim_plot+
swimmer_arrows(df_arrows=ClinicalTrial.Arm,id='id',arrow_start='End_trt',
cont = 'Continued_treatment',name_col='Arm',show.legend = FALSE,type =
"open",cex=1.25)
swim_plot_with_arrows+
ggplot2::scale_color_manual(name="Treatment",values=c("#e41a1c", "#377eb8","#4daf4a"),drop=FALSE)+
ggplot2::scale_fill_manual(name="Treatment",values=c("#e41a1c", "#377eb8","#4daf4a"))+
ggplot2::ylab('Time (Days)')
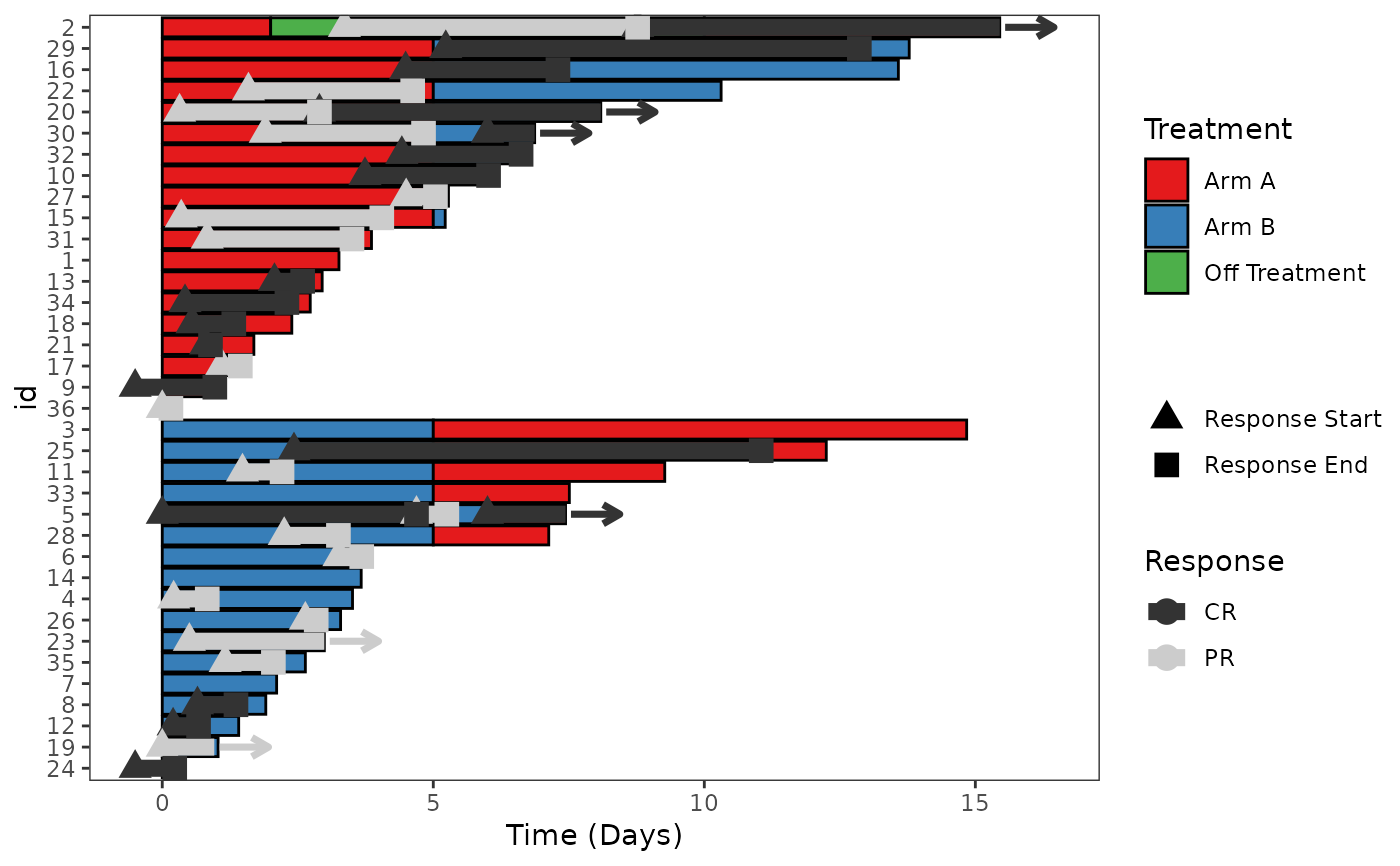
 #Mapping the arrows to lines
#Start with a base swimmer plot with lines and points
swim_plot <-
swimmer_plot(df=ClinicalTrial.Arm,id='id',end='End_trt',name_fill='Arm',col="black",id_order
= 'Arm')+ swimmer_lines(df_lines=ClinicalTrial.Response,id='id',start =
'Response_start',end='Response_end',name_col='Response',size=3)+
swimmer_points_from_lines(df_lines=ClinicalTrial.Response,id='id',start =
'Response_start',end = 'Response_end',cont =
'Continued_response',name_col='Response',size=4)
#> Warning: `gather_()` was deprecated in tidyr 1.2.0.
#> ℹ Please use `gather()` instead.
#> ℹ The deprecated feature was likely used in the swimplot package.
#> Please report the issue to the authors.
# Then add arrows to the plot
swim_plot_with_arrows <- swim_plot+
swimmer_arrows(df_arrows=ClinicalTrial.Response,id='id',arrow_start='Response_end',
cont = 'Continued_response',name_col='Response',show.legend = FALSE,type =
"open",cex=1.25)
# Add ggplot layers to improve the plot's aesthetic
swim_plot_with_arrows+
ggplot2::scale_color_manual(name="Response",values=c("grey20","grey80"))+
ggplot2::scale_fill_manual(name="Treatment",values=c("#e41a1c", "#377eb8","#4daf4a"))+
ggplot2::ylab('Time (Days)')+
ggplot2::guides(fill = ggplot2::guide_legend(override.aes = list(shape =
NA)))+
ggplot2::scale_shape_manual(name='',values=c(17,15),breaks =
c('Response_start','Response_end'),labels=c('Response Start','Response End'))
#Mapping the arrows to lines
#Start with a base swimmer plot with lines and points
swim_plot <-
swimmer_plot(df=ClinicalTrial.Arm,id='id',end='End_trt',name_fill='Arm',col="black",id_order
= 'Arm')+ swimmer_lines(df_lines=ClinicalTrial.Response,id='id',start =
'Response_start',end='Response_end',name_col='Response',size=3)+
swimmer_points_from_lines(df_lines=ClinicalTrial.Response,id='id',start =
'Response_start',end = 'Response_end',cont =
'Continued_response',name_col='Response',size=4)
#> Warning: `gather_()` was deprecated in tidyr 1.2.0.
#> ℹ Please use `gather()` instead.
#> ℹ The deprecated feature was likely used in the swimplot package.
#> Please report the issue to the authors.
# Then add arrows to the plot
swim_plot_with_arrows <- swim_plot+
swimmer_arrows(df_arrows=ClinicalTrial.Response,id='id',arrow_start='Response_end',
cont = 'Continued_response',name_col='Response',show.legend = FALSE,type =
"open",cex=1.25)
# Add ggplot layers to improve the plot's aesthetic
swim_plot_with_arrows+
ggplot2::scale_color_manual(name="Response",values=c("grey20","grey80"))+
ggplot2::scale_fill_manual(name="Treatment",values=c("#e41a1c", "#377eb8","#4daf4a"))+
ggplot2::ylab('Time (Days)')+
ggplot2::guides(fill = ggplot2::guide_legend(override.aes = list(shape =
NA)))+
ggplot2::scale_shape_manual(name='',values=c(17,15),breaks =
c('Response_start','Response_end'),labels=c('Response Start','Response End'))