Adding points to a swimmers plot which match up with lines
swimmer_points_from_lines.RdThis function will create points at the beginning and end of line to match with swimmer_lines.
swimmer_points_from_lines(
  df_lines,
  id = "id",
  start = "start",
  end = "end",
  cont = NULL,
  adj.y = 0,
  name_shape = "type",
  name_col = NULL,
  name_size = NULL,
  name_fill = NULL,
  name_stroke = NULL,
  name_alpha = NULL,
  ...
)
Arguments
- df_lines
a data frame
- id
column name for id, default is 'id'
- start
column name where the line starts, default is 'start'
- end
column name where the line ends, default is 'end'
- cont
a column name of which lines continue (NA is does not continue) these will not have a point at the end of the line
- adj.y
amount to adjust the point within the box vertically (default is 0, point is in the centre of each bar)
- name_shape
a column name to map the point shape
- name_col
a column name to map the point colour
- name_size
a column name to map the point size
- name_fill
a column name to map the point fill
- name_stroke
a column name to map the point stroke
- name_alpha
a column name to map the point transparency
- ...
additional geom_point() arguments
Value
a swimmer plot with points matching the lines
Examples
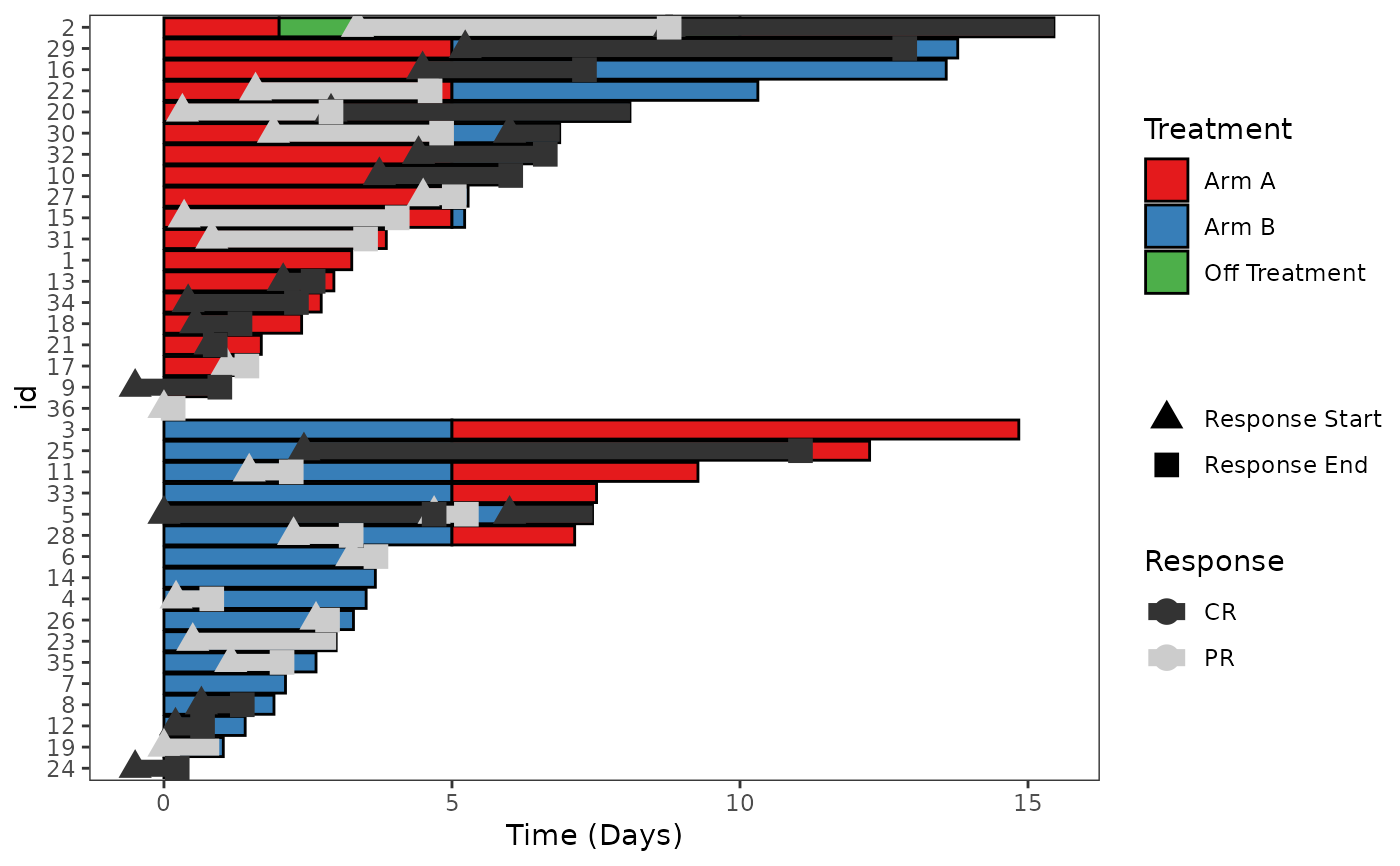
#Start with a base swimmer plot


swim_plot <-swimmer_plot(df=ClinicalTrial.Arm,id='id',end='End_trt',name_fill='Arm',col="black"
,id_order= 'Arm')


# Then add lines to the plot

swim_plot_with_lines <- swim_plot +
swimmer_lines(df_lines=ClinicalTrial.Response,id='id',start =
'Response_start',end='Response_end',name_col='Response',size=3)

# Add points to the start and end of the lines

swim_plot_with_lines_and_points <- swim_plot_with_lines+
swimmer_points_from_lines(df_lines=ClinicalTrial.Response,id='id',start =
'Response_start',end = 'Response_end', cont =
'Continued_response',name_col='Response',size=4)

# Add ggplot layers to improve the plot's aesthetic

swim_plot_with_lines_and_points +
ggplot2::scale_color_manual(name="Response",values=c("grey20","grey80"))+
ggplot2::scale_fill_manual(name="Treatment",values=c("#e41a1c", "#377eb8","#4daf4a"))+
ggplot2::ylab('Time (Days)')+
ggplot2::guides(fill = ggplot2::guide_legend(override.aes = list(shape =
NA)))+
ggplot2::scale_shape_manual(name='',values=c(17,15),breaks =
c('Response_start','Response_end'),labels=c('Response Start','Response End'))