Creating the base of a swimmers plot
swimmer_plot.RdThis function allows you to create swimmers plots with bars, includes options to have the bars change colours and create stratified plots
swimmer_plot(
  df,
  id = "id",
  end = "end",
  start = "start",
  name_fill = NULL,
  name_col = NULL,
  name_alpha = NULL,
  increasing = TRUE,
  id_order = NULL,
  stratify = FALSE,
  base_size = 11,
  identifiers = TRUE,
  ...
)
Arguments
- df
a data frame
- id
column name for id, default is 'id'
- end
column name with the bar lengths (or bar end positions if bars change colour), default is 'end'
- start
column name with the bar start positions (only required when there are gaps between sections of bars, or bars which do not start at zero), default is 'start'
- name_fill
a column name to map the bar fill
- name_col
a column name to map the bar colour
- name_alpha
a column name to map the bar transparency
- increasing
Binary to specify bars in increasing order (Default is TRUE)
- id_order
order of the bars by id, can input a column name to sort by, or the ids in order.
- stratify
a list of column names to stratify by
- base_size
the base size for the plot, default is 11
- identifiers
Binary to specify patient identifiers are included in the y axis (default is TRUE)
- ...
additional geom_col() arguments
Value
a swimmer plot with bars
See also
Examples
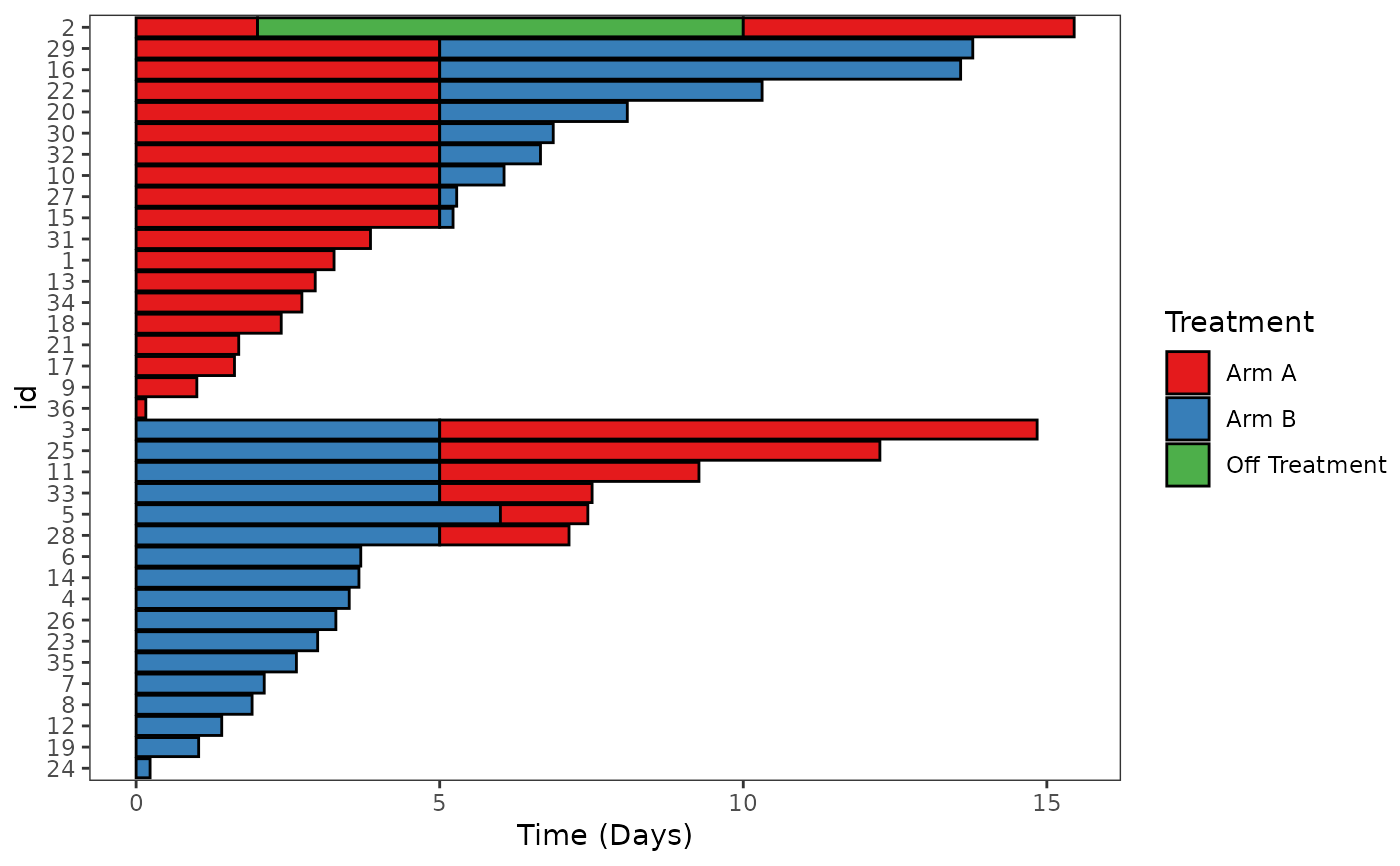
swim_plot <-
swimmer_plot(df=ClinicalTrial.Arm,id='id',end='End_trt',name_fill='Arm',col="black",id_order='Arm')
# Add ggplot layers to improve the plot's aesthetic
swim_plot +
ggplot2::scale_fill_manual(name="Treatment",values=c("#e41a1c", "#377eb8","#4daf4a"))+
ggplot2::ylab('Time (Days)')
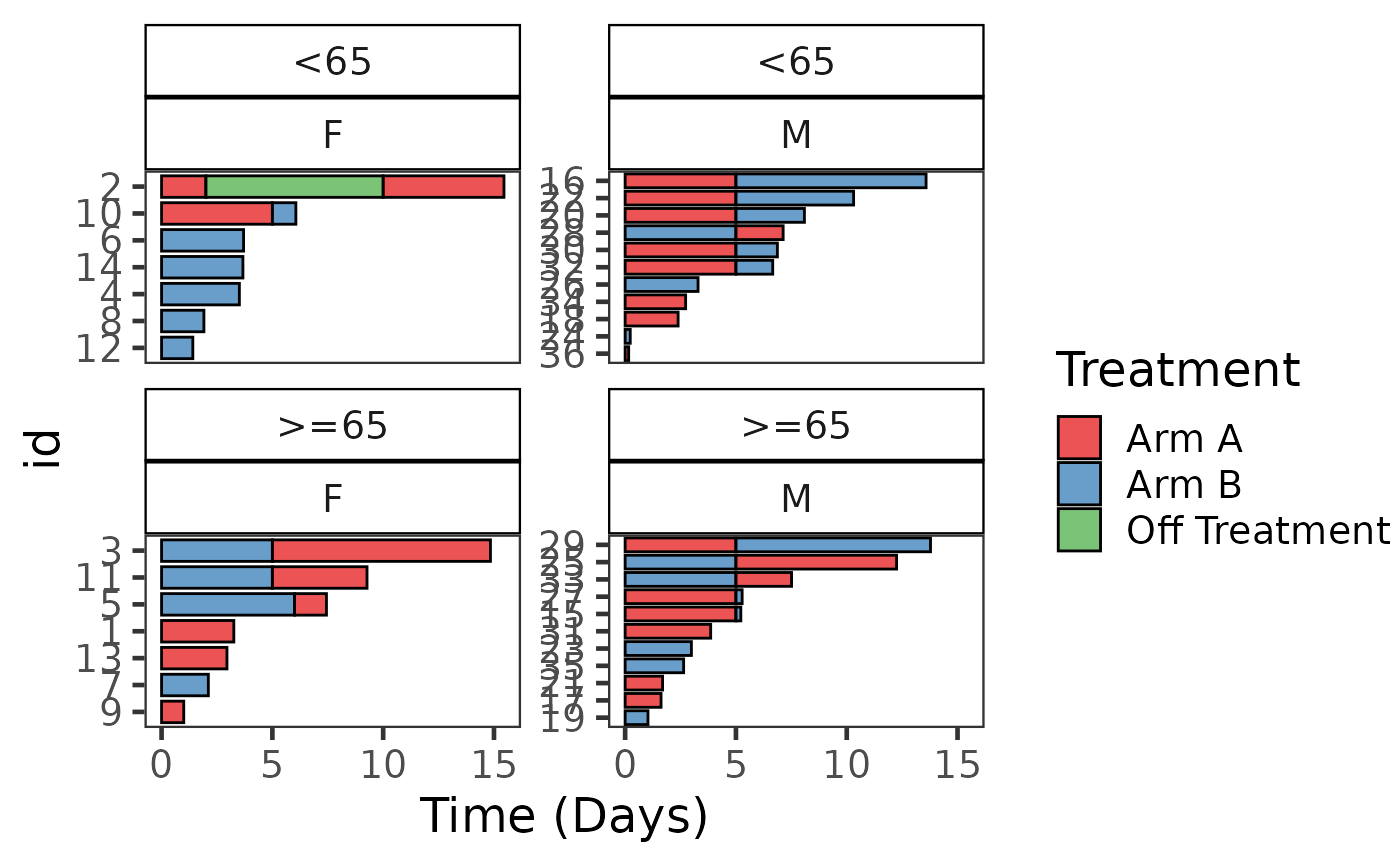
 #Example with Stratification
swim_plot_stratify <- swimmer_plot(df=ClinicalTrial.Arm,id='id',end='End_trt',name_fill='Arm',
col="black",alpha=0.75,width=.8,base_size = 18,stratify= c('Age','Sex'))
swim_plot_stratify +
ggplot2::scale_fill_manual(name="Treatment",values=c("#e41a1c", "#377eb8","#4daf4a"))+
ggplot2::ylab('Time (Days)')
#Example with Stratification
swim_plot_stratify <- swimmer_plot(df=ClinicalTrial.Arm,id='id',end='End_trt',name_fill='Arm',
col="black",alpha=0.75,width=.8,base_size = 18,stratify= c('Age','Sex'))
swim_plot_stratify +
ggplot2::scale_fill_manual(name="Treatment",values=c("#e41a1c", "#377eb8","#4daf4a"))+
ggplot2::ylab('Time (Days)')
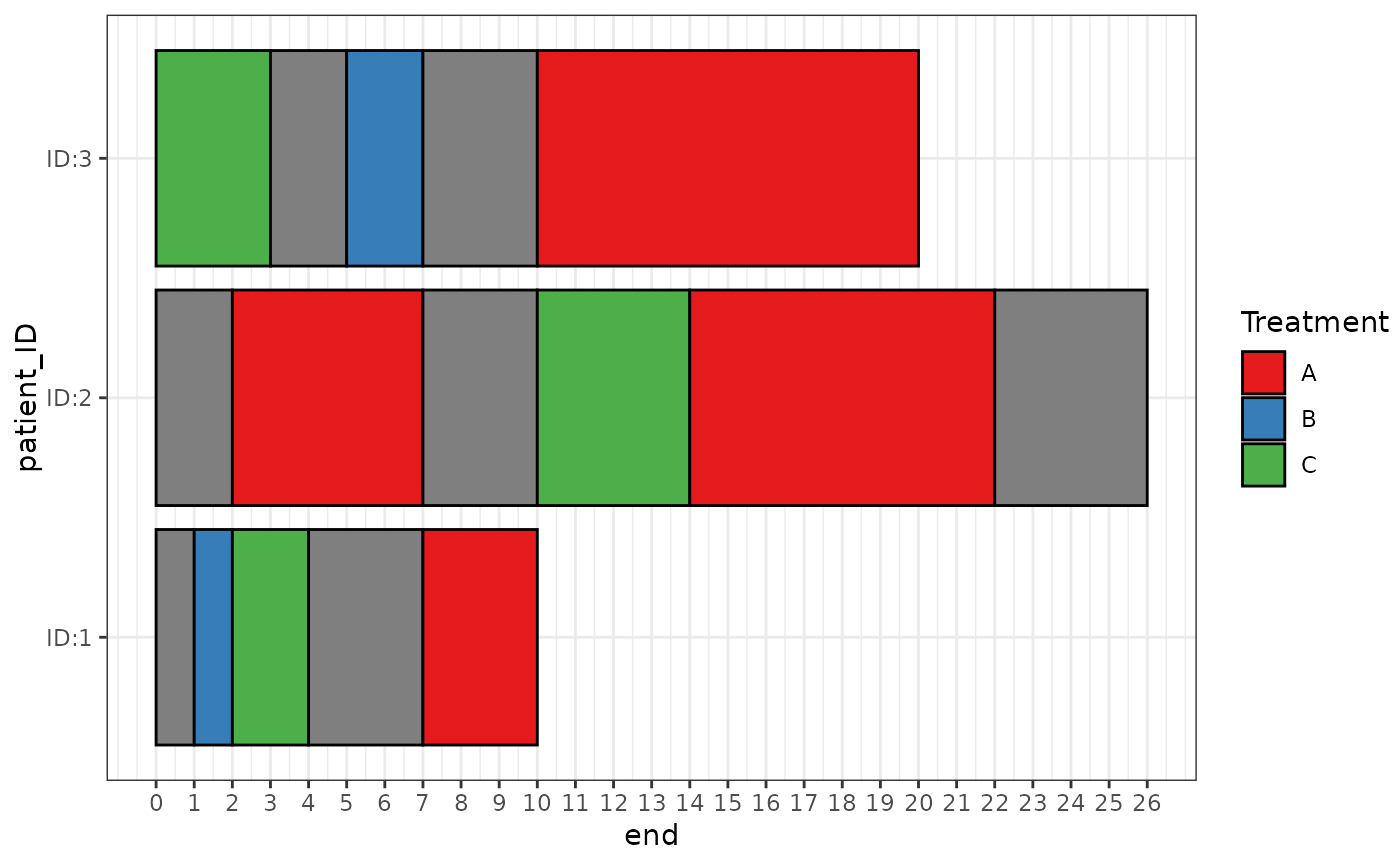
 #Example when there are gaps between the bars and bars do not start at zero
#Both a start and end time need to be specified when there are gaps between sections of bars
Gap_data <- data.frame(patient_ID=c('ID:3','ID:1','ID:1','ID:1','ID:2',
'ID:2','ID:2','ID:3','ID:3','ID:2'),
start=c(10,1,2,7,2,10,14,5,0,22),
end=c(20,2,4,10,7,14,22,7,3,26),
treatment=c("A","B","C","A","A","C","A","B","C",NA))
swimmer_plot(df=Gap_data,id='patient_ID',name_fill="treatment",col=1,identifiers=FALSE,
id_order = c('ID:1','ID:2','ID:3')) +
ggplot2::theme_bw()+ggplot2::scale_fill_manual(name="Treatment",
values=c("A"="#e41a1c", "B"="#377eb8","C"="#4daf4a",na.value=NA),breaks=c("A","B","C"))+
ggplot2::scale_y_continuous(breaks=c(0:26))
#Example when there are gaps between the bars and bars do not start at zero
#Both a start and end time need to be specified when there are gaps between sections of bars
Gap_data <- data.frame(patient_ID=c('ID:3','ID:1','ID:1','ID:1','ID:2',
'ID:2','ID:2','ID:3','ID:3','ID:2'),
start=c(10,1,2,7,2,10,14,5,0,22),
end=c(20,2,4,10,7,14,22,7,3,26),
treatment=c("A","B","C","A","A","C","A","B","C",NA))
swimmer_plot(df=Gap_data,id='patient_ID',name_fill="treatment",col=1,identifiers=FALSE,
id_order = c('ID:1','ID:2','ID:3')) +
ggplot2::theme_bw()+ggplot2::scale_fill_manual(name="Treatment",
values=c("A"="#e41a1c", "B"="#377eb8","C"="#4daf4a",na.value=NA),breaks=c("A","B","C"))+
ggplot2::scale_y_continuous(breaks=c(0:26))