Adding lines to a swimmers plot
swimmer_lines.RdThis function allows you to add lines to a swimmers plot created with swimmer_plot
swimmer_lines(
  df_lines,
  id = "id",
  start = "start",
  end = "end",
  adj.y = 0,
  name_linetype = NULL,
  name_col = NULL,
  name_size = NULL,
  name_alpha = NULL,
  ...
)
Arguments
- df_lines
a data frame
- id
column name for id, default is 'id'
- start
column name with the line start locations
- end
column name with the line end locations
- adj.y
amount to adjust the line within the box vertically (default is 0, line is in the centre of each bar)
- name_linetype
a column name to map the line type
- name_col
a column name to map the line colour
- name_size
a column name to map the line size
- name_alpha
a column name to map the line transparency
- ...
additional geom_segment() arguments
Value
a swimmer plot with lines
See also
Examples
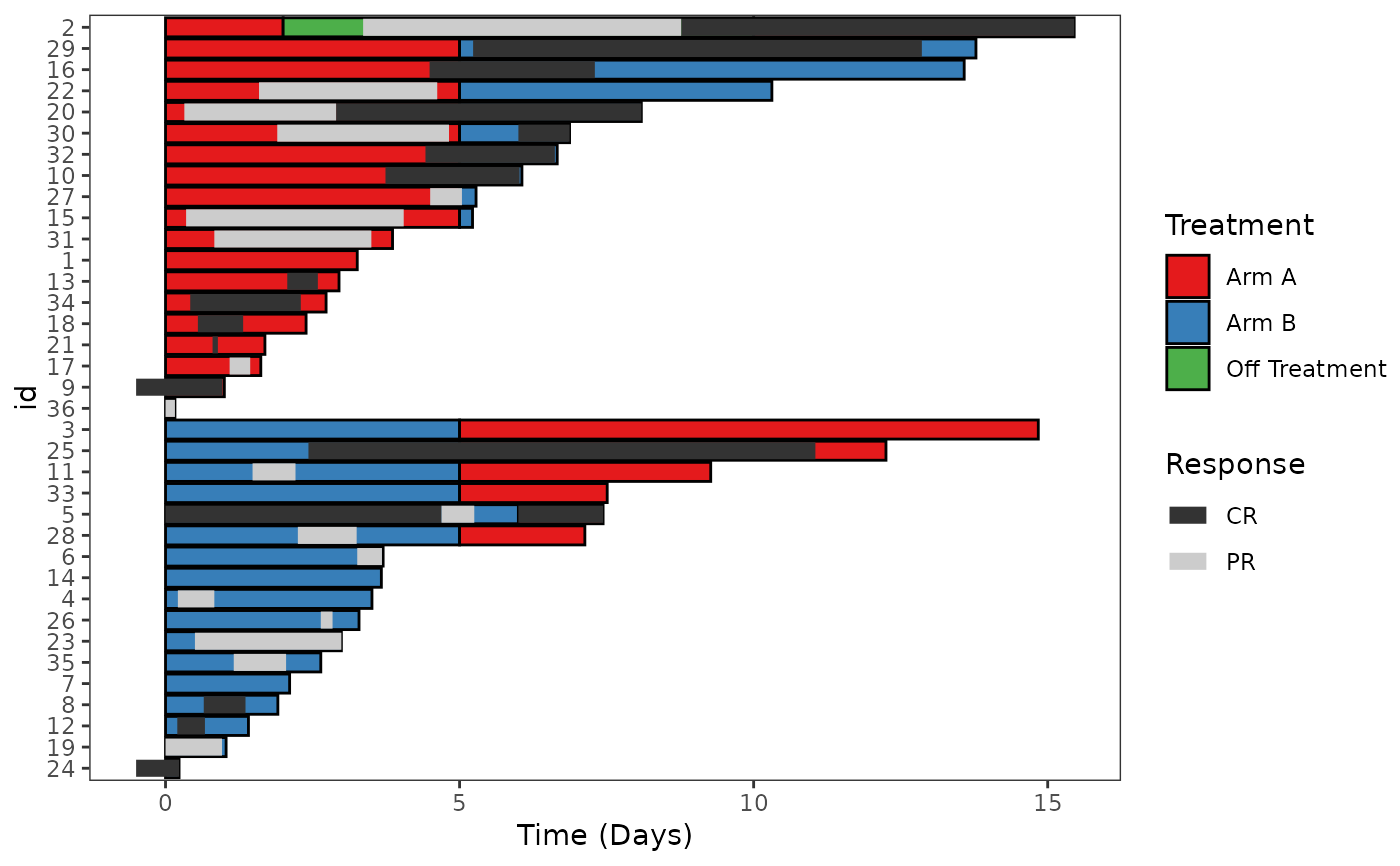
#Start with a base swimmer plot
swim_plot <-
swimmer_plot(df=ClinicalTrial.Arm,id='id',end='End_trt',name_fill='Arm',col="black",id_order='Arm')


# Then add lines to the plot

swim_plot_with_lines <- swim_plot +
swimmer_lines(df_lines=ClinicalTrial.Response,id='id',start =
'Response_start',end='Response_end',name_col='Response',size=3)


# Add ggplot layers to improve the plot's aesthetic

swim_plot_with_lines +
ggplot2::scale_color_manual(name="Response",values=c("grey20","grey80"))+
ggplot2::scale_fill_manual(name="Treatment",values=c("#e41a1c", "#377eb8","#4daf4a"))+
ggplot2::ylab('Time (Days)')