Source:
vignettes/plot_surv.Rmd
plot_surv.RmdThis document explains Survival Curves related plotting using ggplot2 and ggfortify.
Plotting with survival package
ggfortify let ggplot2 know how to draw
survival curves. After loading ggfortify, you can use
ggplot2::autoplot function for survfit
objects.
library(ggfortify)
library(survival)
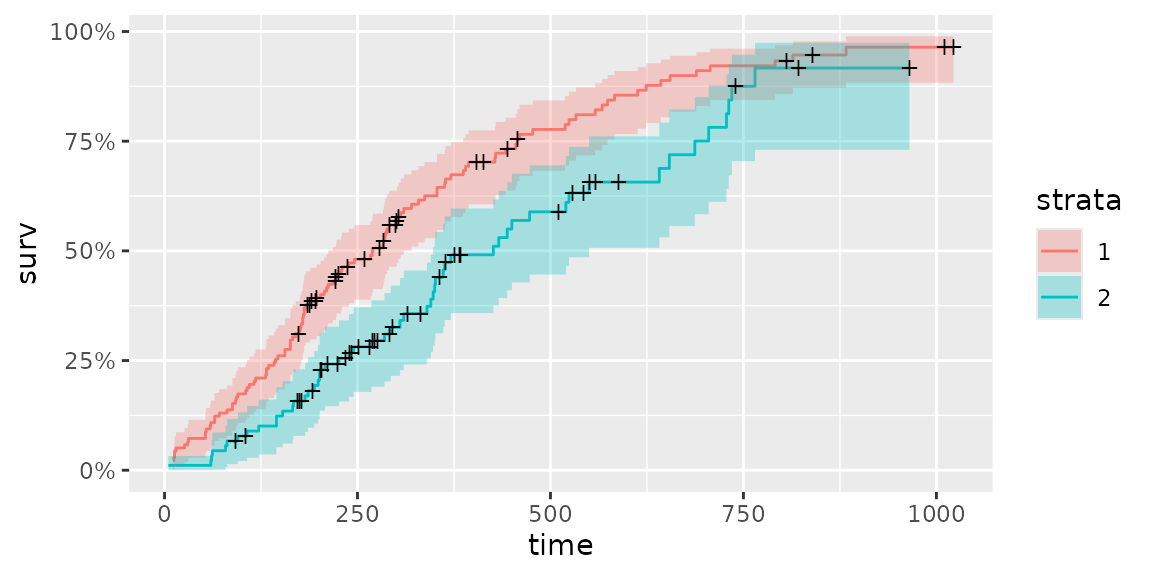
fit <- survfit(Surv(time, status) ~ sex, data = lung)
autoplot(fit)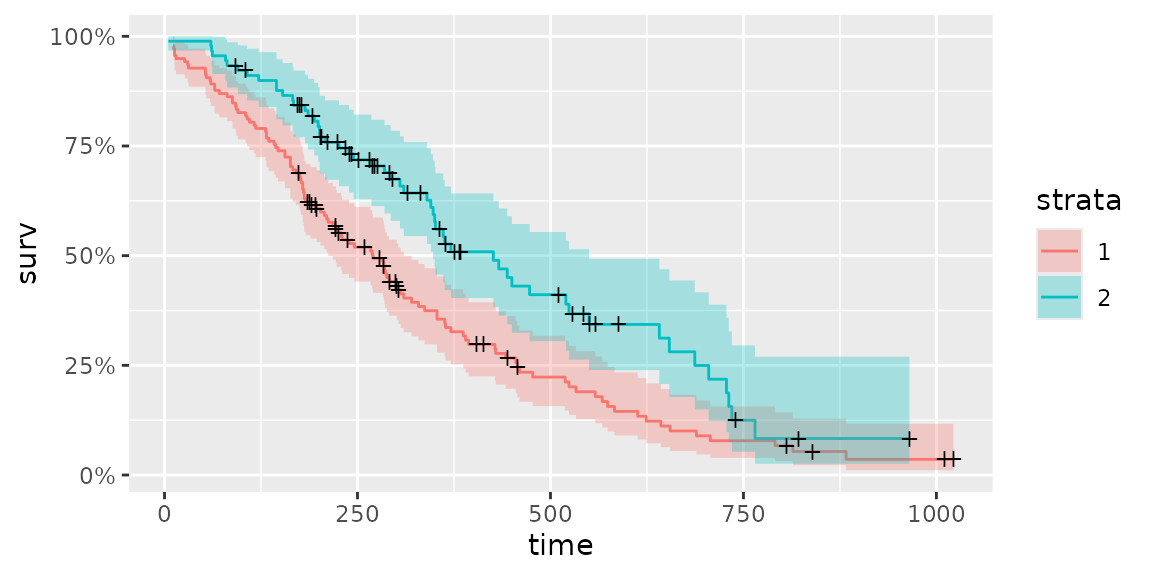
There are some options to change survival curve output. Use
help(autoplot.survfit) (or help(autoplot.*)
for any other objects) to check available options.
autoplot(fit, surv.linetype = 'dashed', conf.int = FALSE,
         censor.shape = '*', censor.size = 5, facets = TRUE, ncol = 2)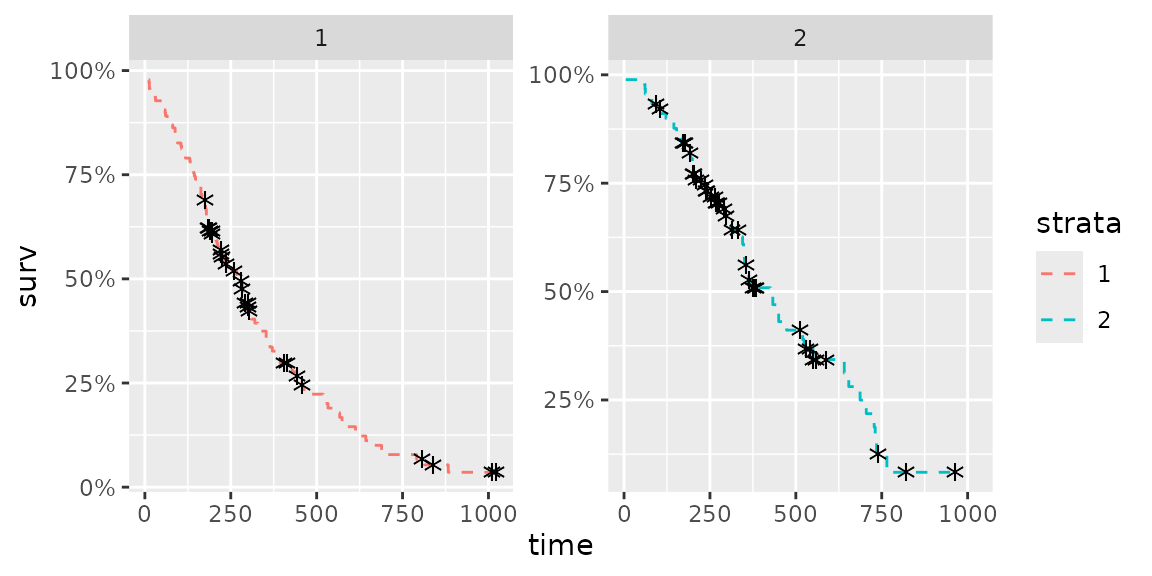
autoplot(survfit(Surv(time, status) ~ 1, data = lung), surv.colour = 'orange', censor.colour = 'red')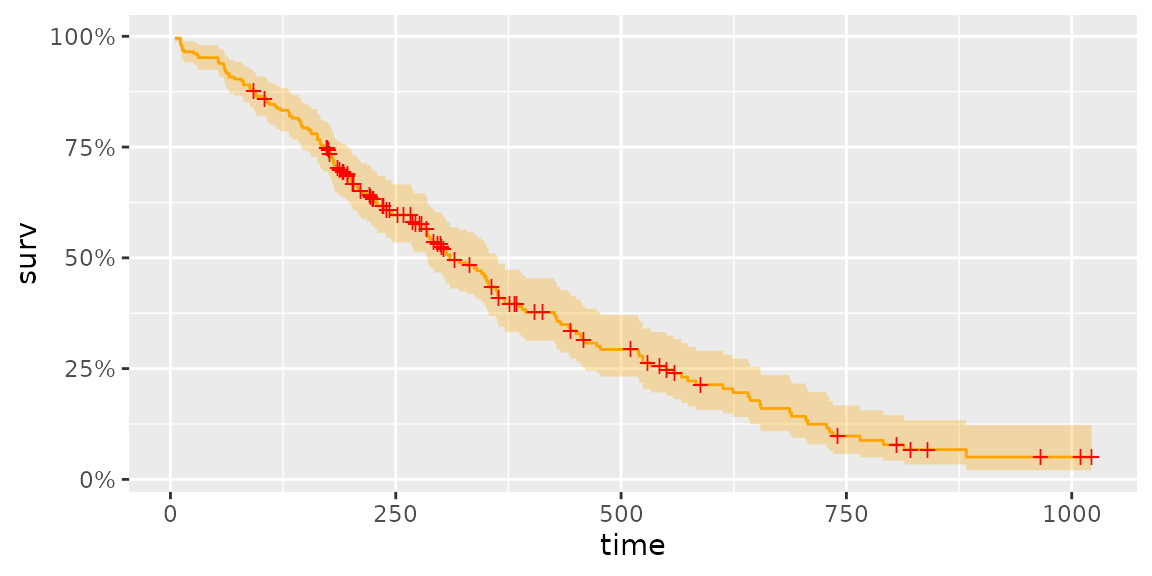
d.coxph <- survfit(coxph(Surv(time, status) ~ sex, data = lung))
autoplot(d.coxph, surv.linetype = 'dashed', surv.colour = 'blue',
         conf.int.fill = 'dodgerblue3', conf.int.alpha = 0.5, censor = FALSE)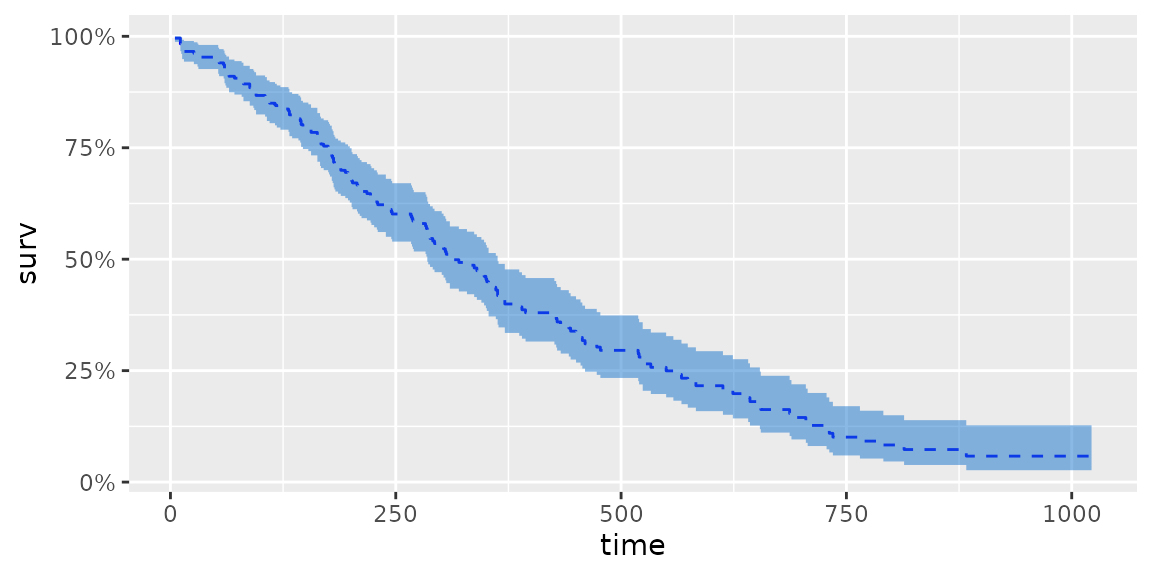
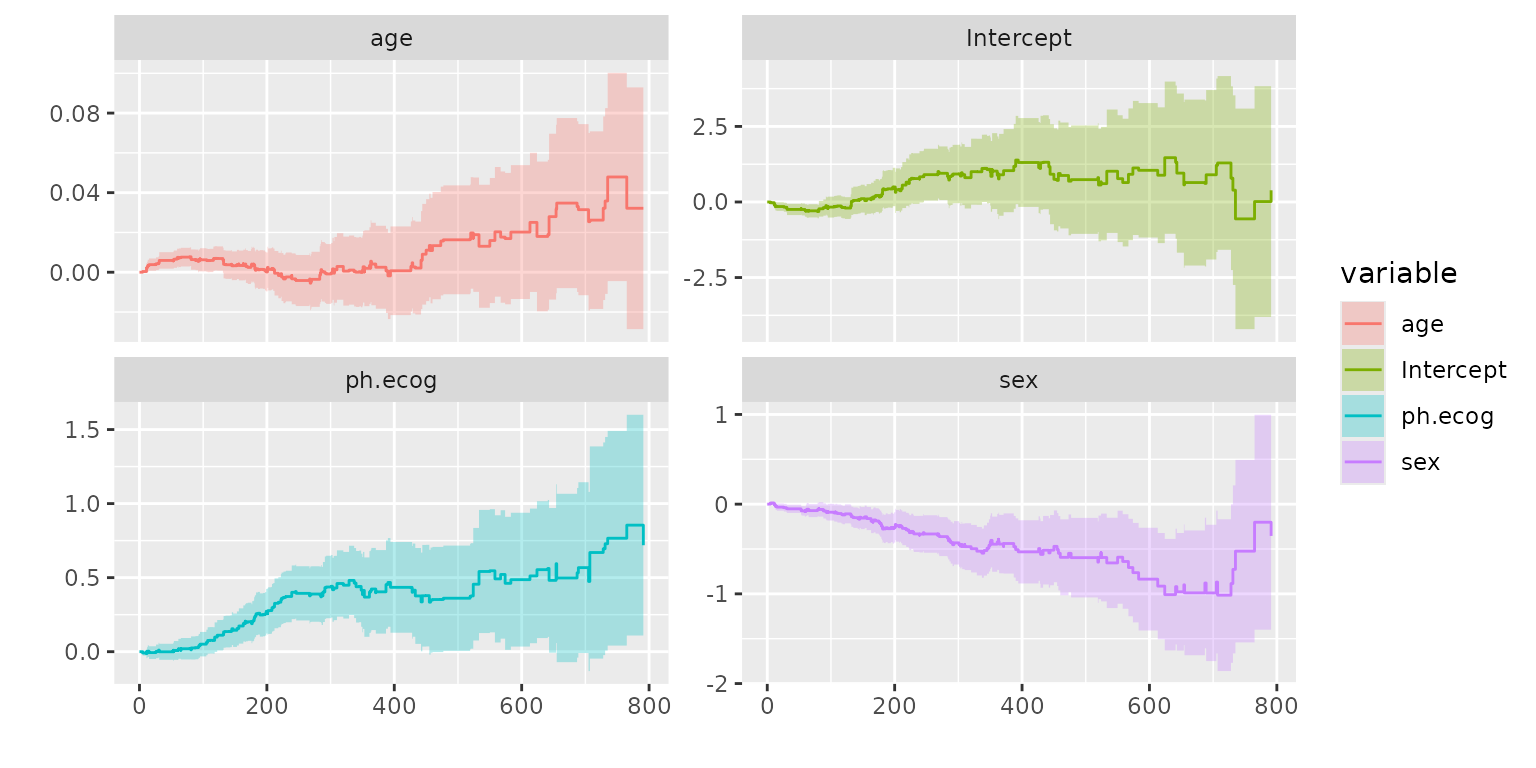
Also, you can use autoplot for
survival::aareg instance.