Plot base::matrix
Usage
# S3 method for class 'matrix'
autoplot(
  object,
  original = NULL,
  geom = "tile",
  colour = NULL,
  size = NULL,
  alpha = NULL,
  fill = "#0000FF",
  shape = NULL,
  label = FALSE,
  label.label = "rownames",
  label.colour = colour,
  label.alpha = NULL,
  label.size = NULL,
  label.angle = NULL,
  label.family = NULL,
  label.fontface = NULL,
  label.lineheight = NULL,
  label.hjust = NULL,
  label.vjust = NULL,
  label.repel = FALSE,
  scale = NULL,
  xlim = c(NA, NA),
  ylim = c(NA, NA),
  log = "",
  main = NULL,
  xlab = NULL,
  ylab = NULL,
  asp = NULL,
  ...
)
Arguments
- object
base::matrixinstance- original
Combined to data by column if provided. Intended to be used for stat functions which returns not containing original data.
- geom
Geometric string for plotting. 'tile' or 'point'.
- colour
colour for points ('point' only)
- size
point size
- alpha
alpha
- fill
fill colour. Ignored if scale keyword is passed. ('tile' Only)
- shape
point shape
- label
Logical value whether to display labels
- label.label
Column name used for label text
- label.colour
Colour for text labels
- label.alpha
Alpha for text labels
- label.size
Size for text labels
- label.angle
Angle for text labels
- label.family
Font family for text labels
- label.fontface
Fontface for text labels
- label.lineheight
Lineheight for text labels
- label.hjust
Horizontal adjustment for text labels
- label.vjust
Vertical adjustment for text labels
- label.repel
Logical flag indicating whether to use
ggrepel, enabling this may take some time for plotting- scale
(Deprecated)
ggplot2::scaleinstance to plot. ('tile' Only)- xlim
limits for x axis
- ylim
limits for y axis
- log
which variables to log transform ("x", "y", or "xy")
- main
character vector or expression for plot title
- xlab
character vector or expression for x axis label
- ylab
character vector or expression for y axis label
- asp
the y/x aspect ratio
- ...
other arguments passed to methods
Examples
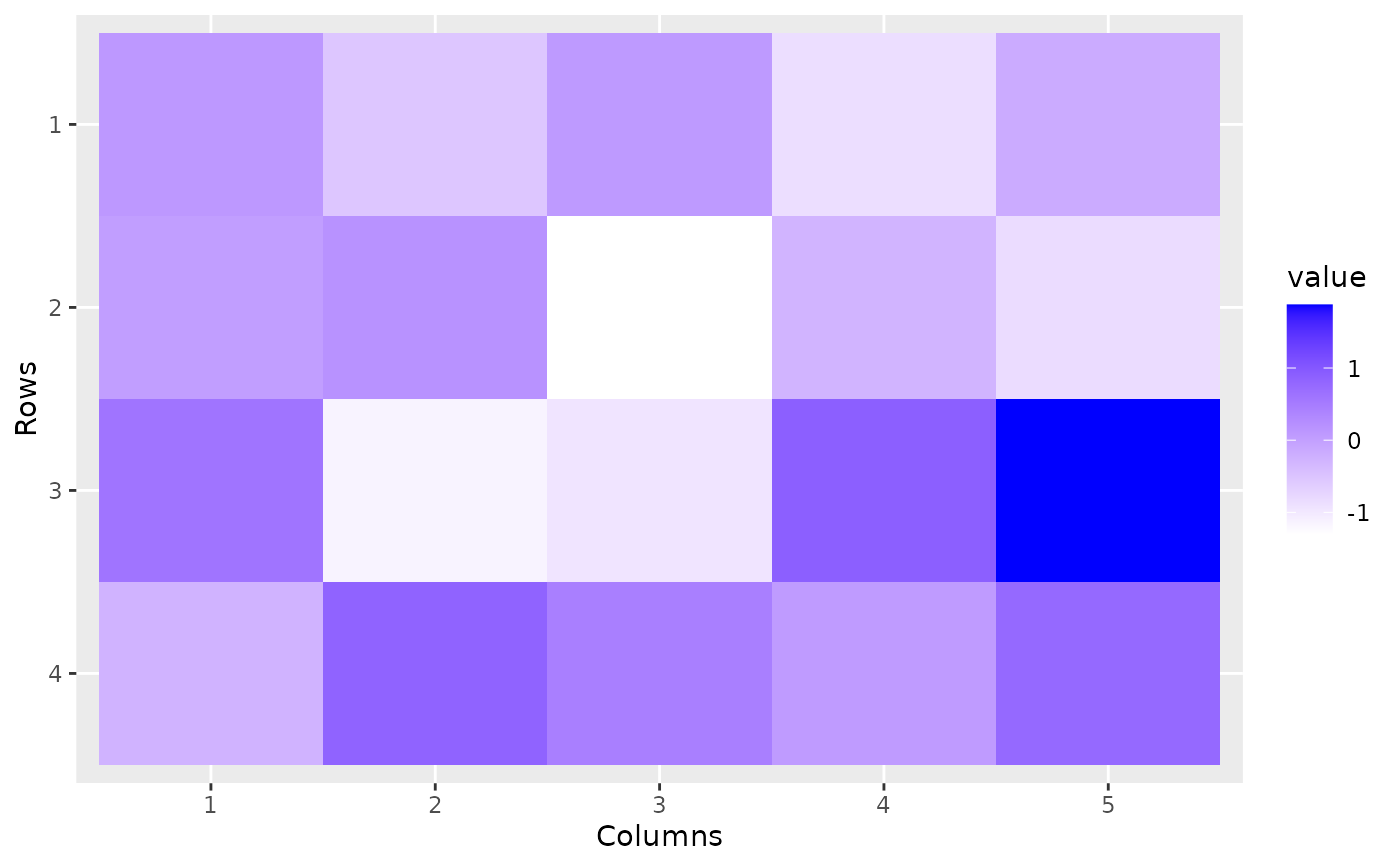
autoplot(matrix(rnorm(20), nc = 5))
#> Warning: Arguments in `...` must be used.
#> ✖ Problematic argument:
#> • original = original
#> ℹ Did you misspell an argument name?
#> Scale for y is already present.
#> Adding another scale for y, which will replace the existing scale.
 autoplot(matrix(rnorm(20), nc = 5), fill = 'red')
#> Warning: Arguments in `...` must be used.
#> ✖ Problematic argument:
#> • original = original
#> ℹ Did you misspell an argument name?
#> Scale for y is already present.
#> Adding another scale for y, which will replace the existing scale.
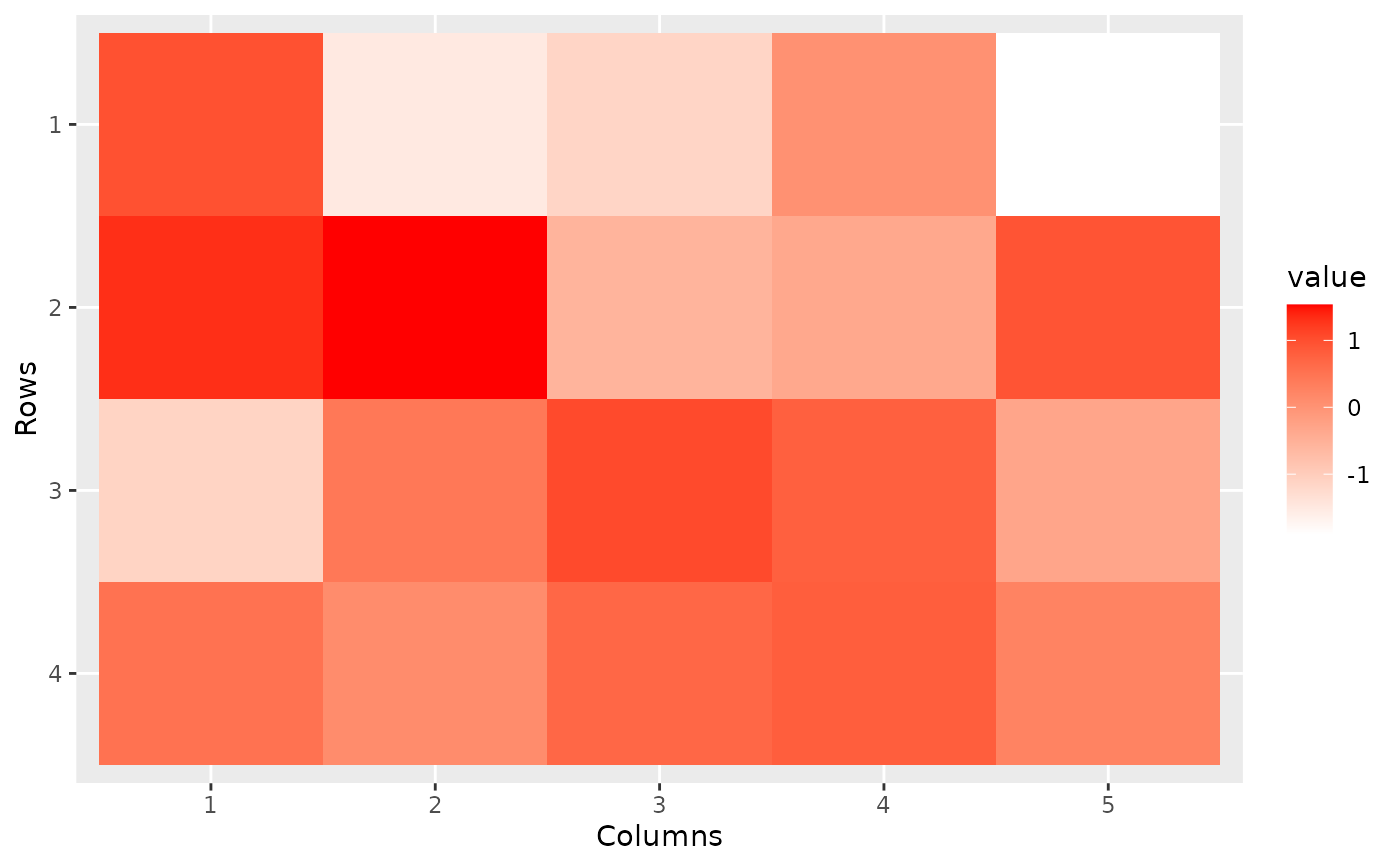
autoplot(matrix(rnorm(20), nc = 5), fill = 'red')
#> Warning: Arguments in `...` must be used.
#> ✖ Problematic argument:
#> • original = original
#> ℹ Did you misspell an argument name?
#> Scale for y is already present.
#> Adding another scale for y, which will replace the existing scale.
 autoplot(matrix(rnorm(20), nc = 2), geom = 'point')
#> Warning: Arguments in `...` must be used.
#> ✖ Problematic argument:
#> • original = original
#> ℹ Did you misspell an argument name?
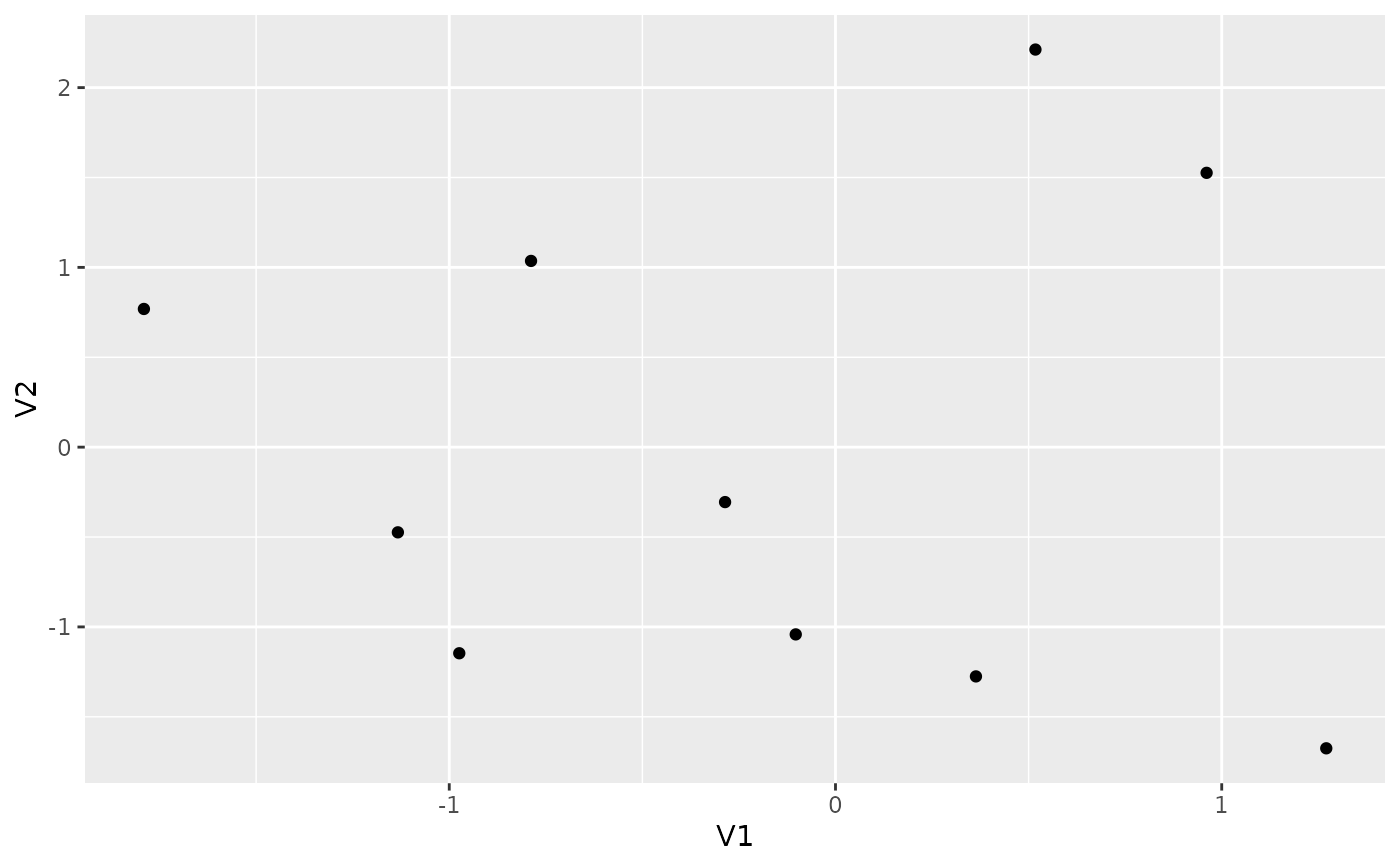
autoplot(matrix(rnorm(20), nc = 2), geom = 'point')
#> Warning: Arguments in `...` must be used.
#> ✖ Problematic argument:
#> • original = original
#> ℹ Did you misspell an argument name?