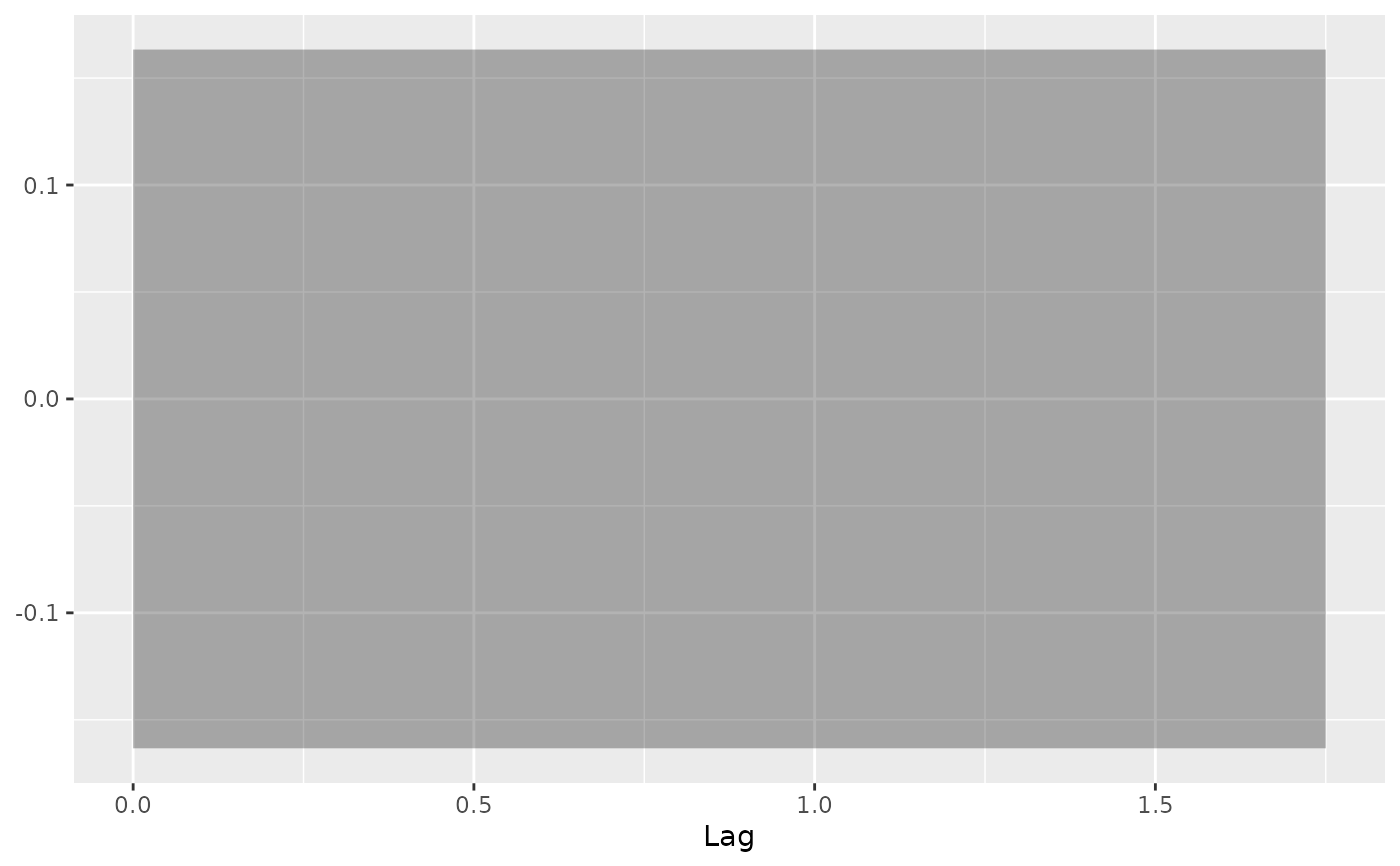
Attach confidence interval to ggplot2::ggplot
Usage
plot_confint(
  p,
  data = NULL,
  lower = "lower",
  upper = "upper",
  conf.int = TRUE,
  conf.int.geom = "line",
  conf.int.group = NULL,
  conf.int.colour = "#0000FF",
  conf.int.linetype = "none",
  conf.int.fill = "#000000",
  conf.int.alpha = 0.3
)
Arguments
- p
ggplot2::ggplotinstance- data
data contains lower and upper confidence intervals
- lower
column name for lower confidence interval
- upper
column name for upper confidence interval
- conf.int
Logical flag indicating whether to plot confidence intervals
- conf.int.geom
geometric string for confidence interval. 'line' or 'step'
- conf.int.group
name of grouping variable for confidence intervals
- conf.int.colour
line colour for confidence intervals
- conf.int.linetype
line type for confidence intervals
- conf.int.fill
fill colour for confidence intervals
- conf.int.alpha
alpha for confidence intervals
Examples
d <- fortify(stats::acf(AirPassengers, plot = FALSE))
p <- ggplot(data = d, mapping = aes(x = Lag))
ggfortify:::plot_confint(p, data = d)