To be used with coord_flex_cart,
coord_capped_cart, etc. for displaying brackets instead
of the axis ticks and lines.
Arguments
Details
The looks of the brackets are taken from theme(axis.ticks), or
theme(axis.ticks.x) and theme(axis.ticks.y), respectively.
It does not re-calculate tick marks, but lets scale_x_* and scale_y_*
calculate and draw ticks and labels, and then modifies the ticks with brackets.
Both length and tick.length accepts a numeric scalar instead of
a unit object that is interpreted as an "npc" unit.
See also
Examples
library(ggplot2)
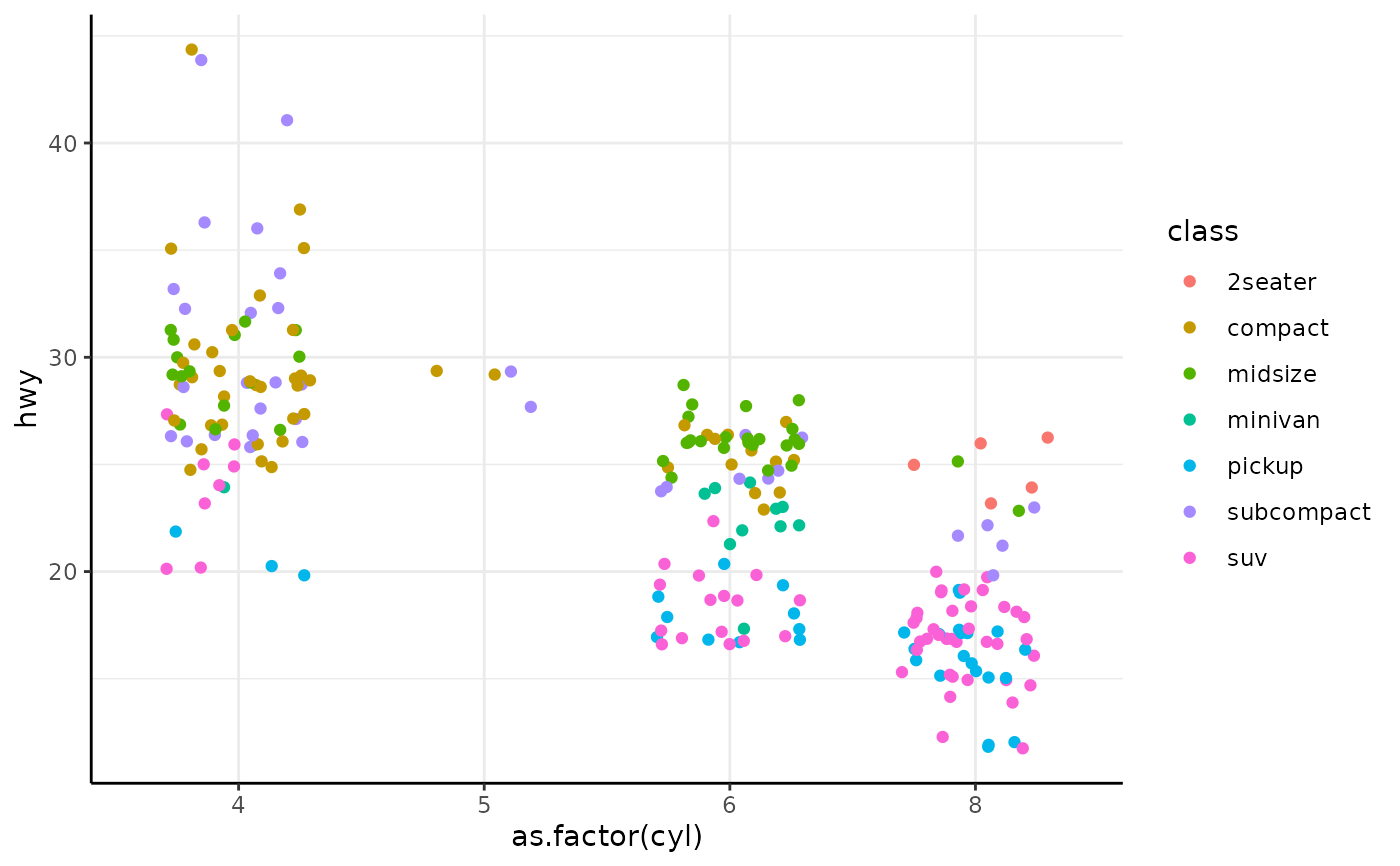
p <- ggplot(mpg, aes(as.factor(cyl), hwy, colour=class)) +
geom_point(position=position_jitter(width=0.3)) +
theme_bw() +
theme(panel.border = element_blank(), axis.line = element_line())
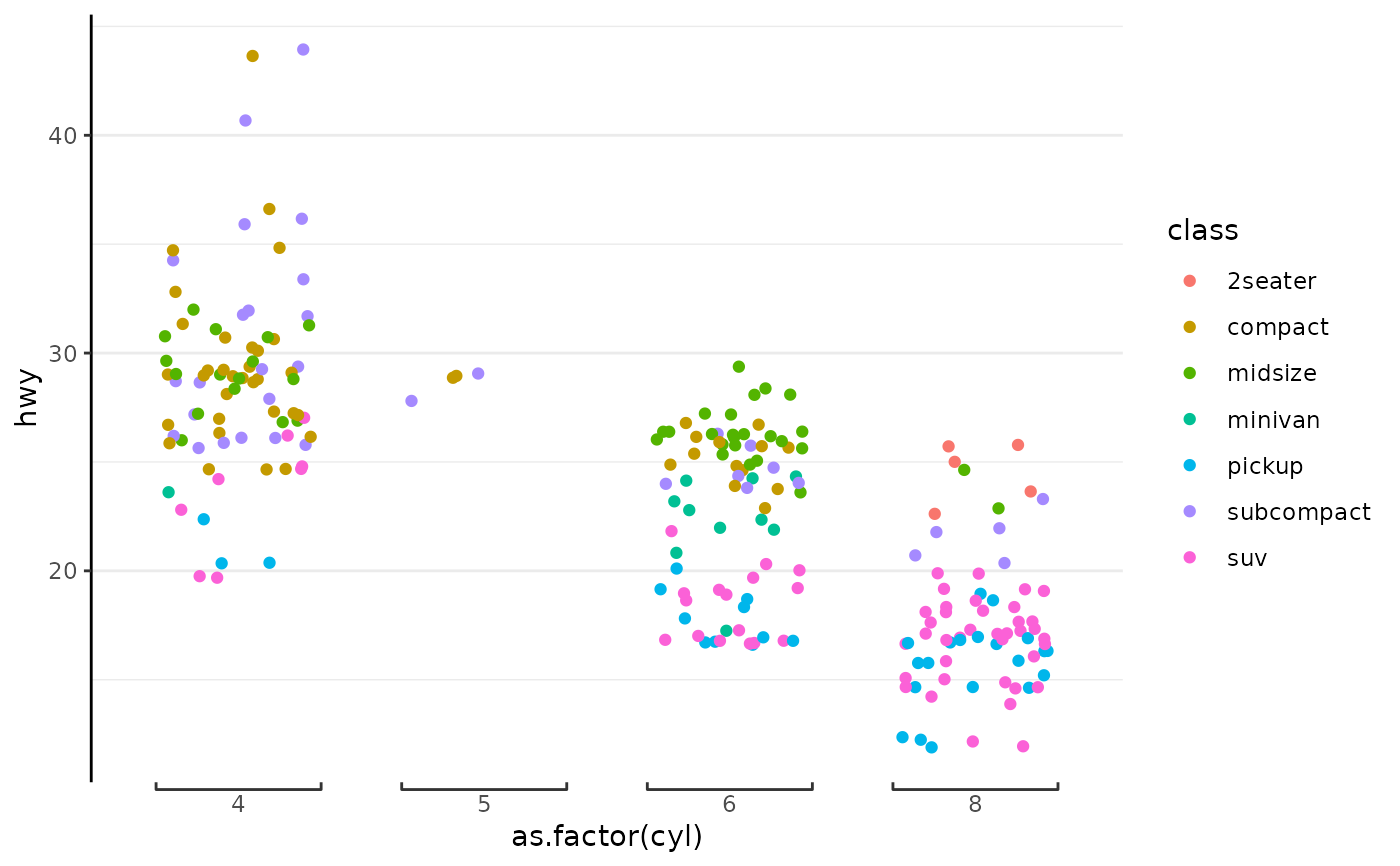
p
 p <- p + coord_flex_cart(bottom=brackets_horizontal(length=unit(0.08, 'npc')))
p
p <- p + coord_flex_cart(bottom=brackets_horizontal(length=unit(0.08, 'npc')))
p
 # However getting the correct width is a matter of tweaking either length or
# position_jitter...
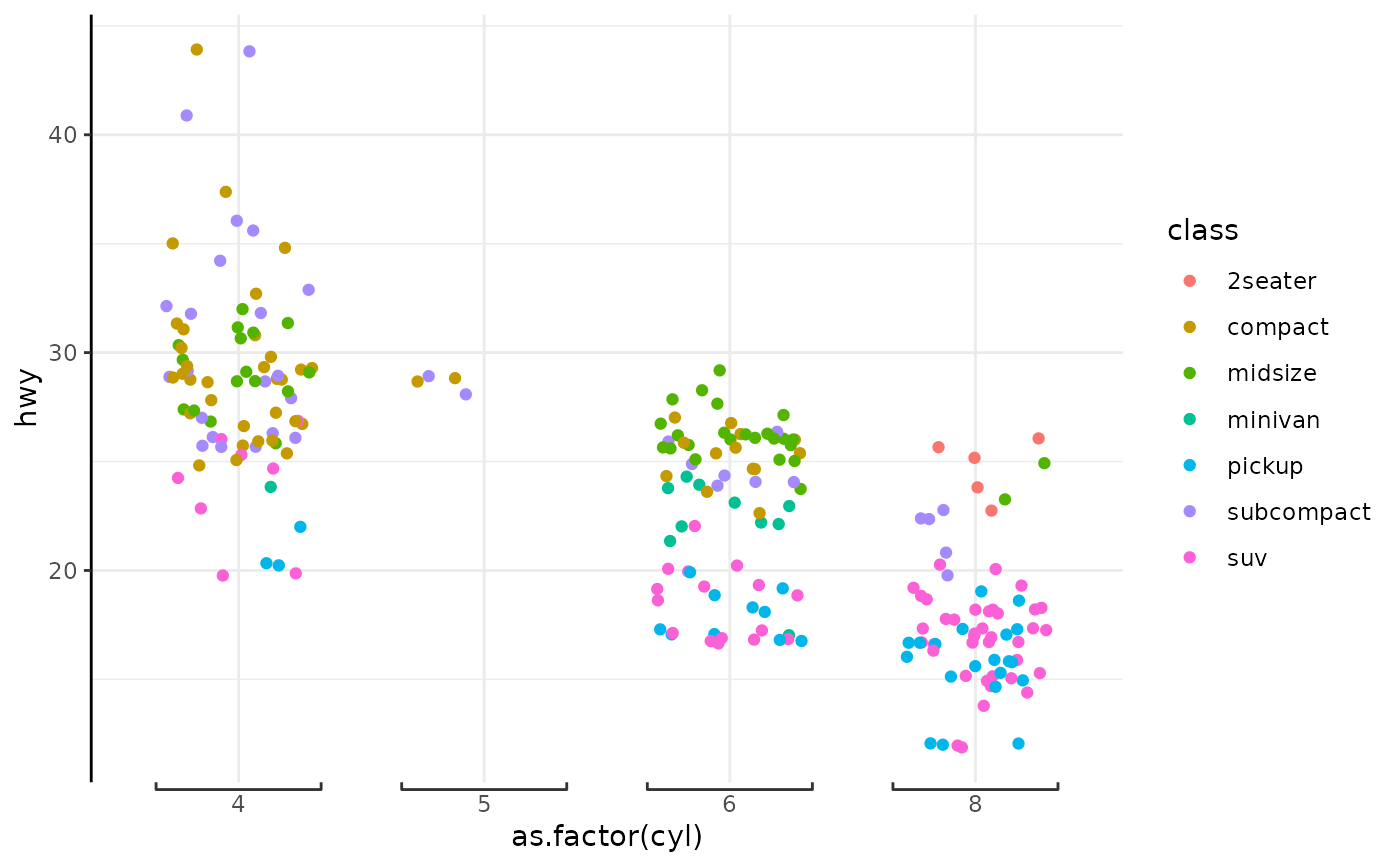
# A further adjustment,
p + theme(panel.grid.major.x = element_blank())
# However getting the correct width is a matter of tweaking either length or
# position_jitter...
# A further adjustment,
p + theme(panel.grid.major.x = element_blank())