Allows user to inject a function for drawing axes, such as
capped_horizontal or brackets_horizontal.
coord_flex_cart(
  xlim = NULL,
  ylim = NULL,
  expand = TRUE,
  top = waiver(),
  left = waiver(),
  bottom = waiver(),
  right = waiver()
)

coord_flex_flip(
  xlim = NULL,
  ylim = NULL,
  expand = TRUE,
  top = waiver(),
  left = waiver(),
  bottom = waiver(),
  right = waiver()
)

coord_flex_fixed(
  ratio = 1,
  xlim = NULL,
  ylim = NULL,
  expand = TRUE,
  top = waiver(),
  left = waiver(),
  bottom = waiver(),
  right = waiver()
)
Arguments
- xlim, ylim
Limits for the x and y axes.
- expand
If
TRUE, the default, adds a small expansion factor to the limits to ensure that data and axes don't overlap. IfFALSE, limits are taken exactly from the data orxlim/ylim.- top, left, bottom, right
Function for drawing axis lines, ticks, and labels, use e.g.
capped_horizontalorbrackets_horizontal.- ratio
aspect ratio, expressed as
y / x.
Details
NB! A panel-border is typically drawn on top such that it covers tick marks,
grid lines, and axis lines.
Many themes also do not draw axis lines.
To ensure the modified axis lines are visible, use
theme(panel.border=element_blank(), axis.line=element_line()).
User defined functions
The provided function in top, right, bottom, and left
defaults to render_axis which is defined in ggplot2/R/coord-.r, which in
turns calls guide_axis (see ggplot2/R/guides-axis.r).
The provided function is with the arguments
scale_details, axis, scale, position, and theme,
and the function should return an absoluteGrob object.
For examples of modifying the drawn object, see e.g.
capped_horizontal or brackets_horizontal.
Examples
library(ggplot2)
# A standard plot
p <- ggplot(mtcars, aes(disp, wt)) +
geom_point() +
geom_smooth() + theme(panel.border=element_blank(), axis.line=element_line())
# We desire that left axis does not extend beyond '6'
# and the x-axis is unaffected
p + coord_capped_cart(left='top')
#> `geom_smooth()` using method = 'loess' and formula = 'y ~ x'
 # Specifying 'bottom' caps the axis with at most the length of 'gap'
p + coord_capped_cart(left='top', bottom='none')
#> `geom_smooth()` using method = 'loess' and formula = 'y ~ x'
# Specifying 'bottom' caps the axis with at most the length of 'gap'
p + coord_capped_cart(left='top', bottom='none')
#> `geom_smooth()` using method = 'loess' and formula = 'y ~ x'
 # We can specify a ridiculus large 'gap', but the lines will always
# protrude to the outer most ticks.
p + coord_capped_cart(left='top', bottom='none', gap=2)
#> `geom_smooth()` using method = 'loess' and formula = 'y ~ x'
# We can specify a ridiculus large 'gap', but the lines will always
# protrude to the outer most ticks.
p + coord_capped_cart(left='top', bottom='none', gap=2)
#> `geom_smooth()` using method = 'loess' and formula = 'y ~ x'
 # We can use 'capped_horizontal' and 'capped_vertical' to specify for
# each axis individually.
p + coord_capped_cart(left='top', bottom=capped_horizontal('none', gap=2))
#> `geom_smooth()` using method = 'loess' and formula = 'y ~ x'
# We can use 'capped_horizontal' and 'capped_vertical' to specify for
# each axis individually.
p + coord_capped_cart(left='top', bottom=capped_horizontal('none', gap=2))
#> `geom_smooth()` using method = 'loess' and formula = 'y ~ x'
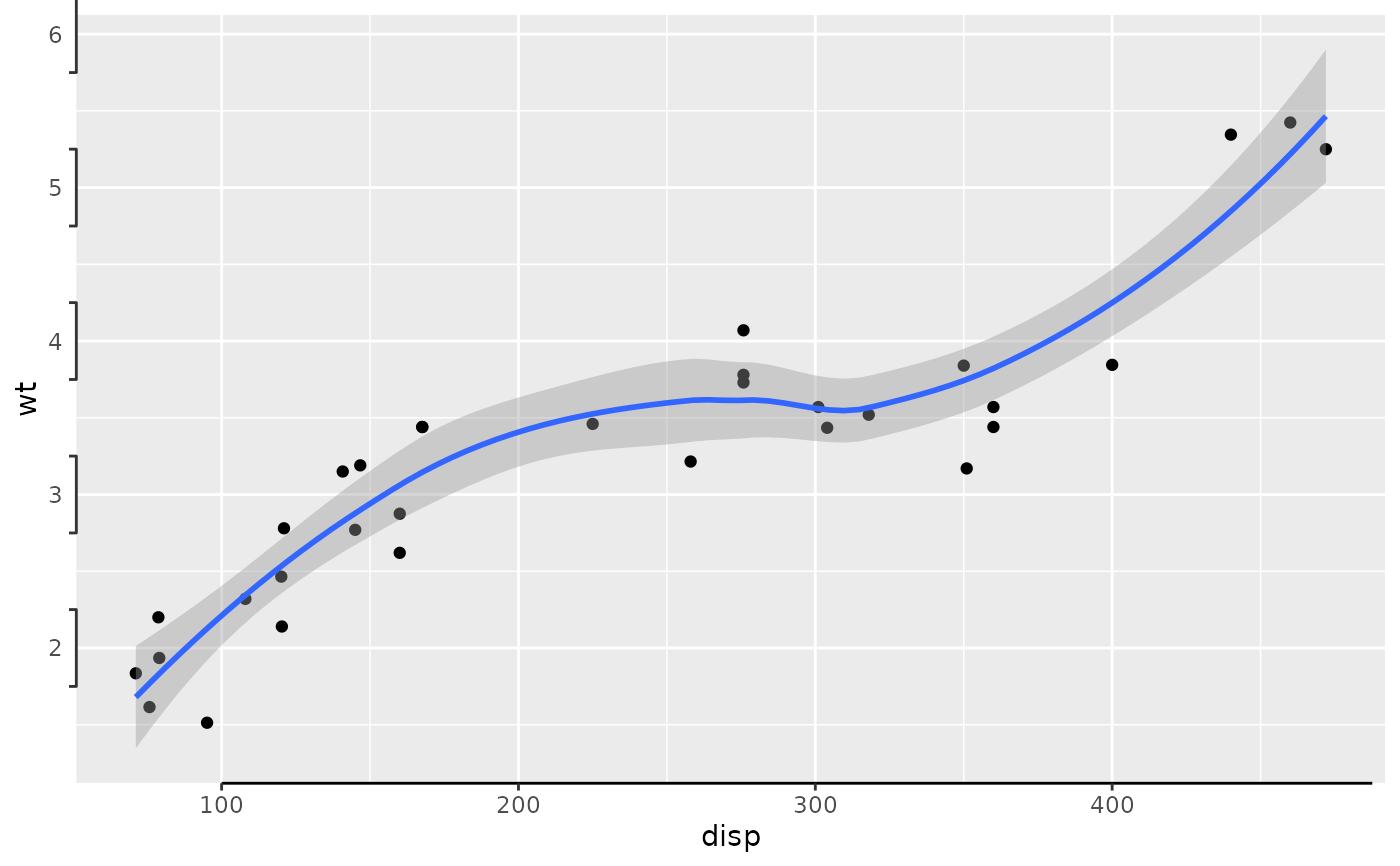
 # At this point we might as well drop using the short-hand and go full on:
p + coord_flex_cart(left=brackets_vertical(), bottom=capped_horizontal('left'))
#> `geom_smooth()` using method = 'loess' and formula = 'y ~ x'
# At this point we might as well drop using the short-hand and go full on:
p + coord_flex_cart(left=brackets_vertical(), bottom=capped_horizontal('left'))
#> `geom_smooth()` using method = 'loess' and formula = 'y ~ x'
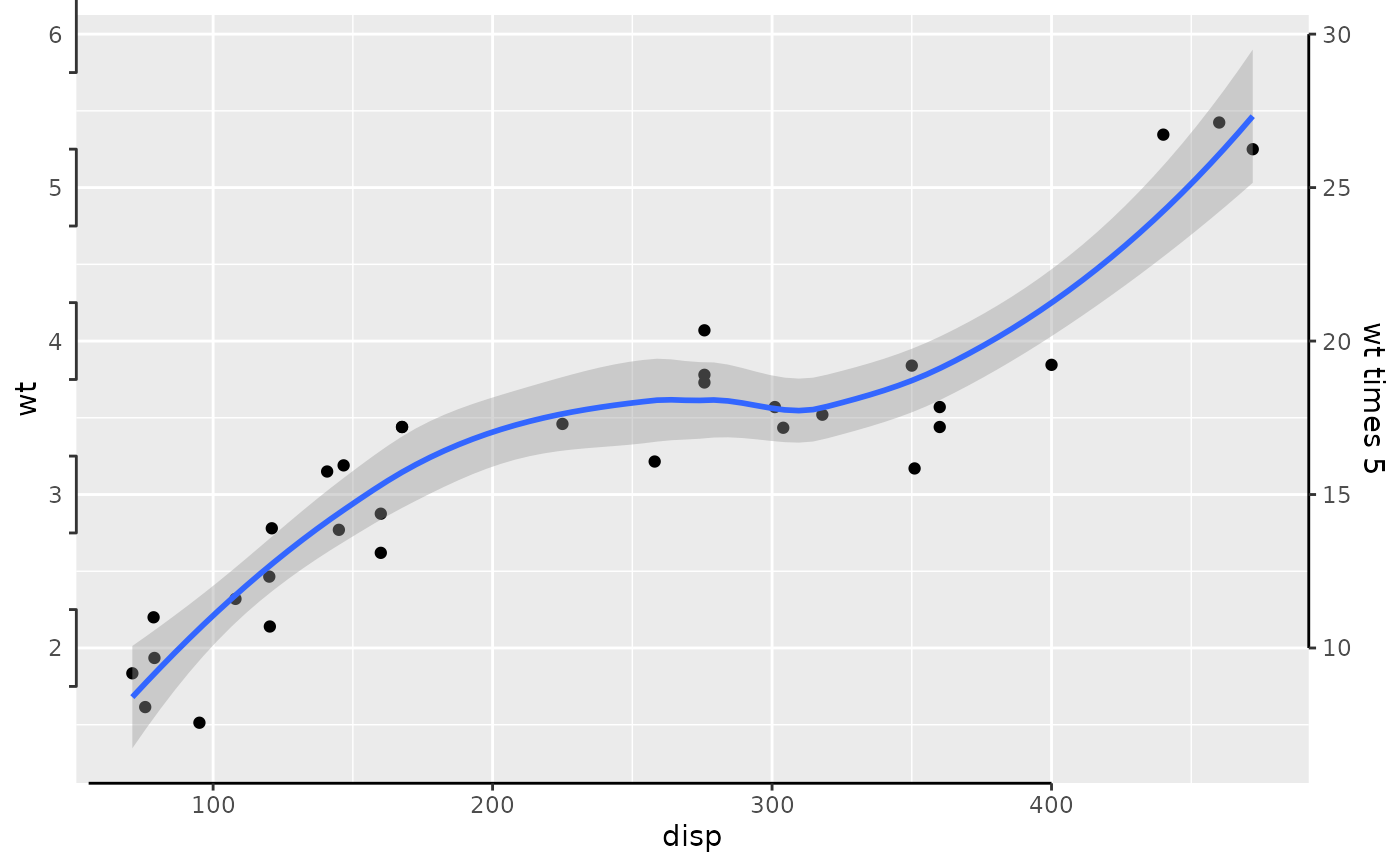
 # Also works with secondary axes:
p + scale_y_continuous(sec.axis=sec_axis(~5*., name='wt times 5')) +
coord_flex_cart(left=brackets_vertical(), bottom=capped_horizontal('right'),
right=capped_vertical('both', gap=0.02))
#> `geom_smooth()` using method = 'loess' and formula = 'y ~ x'
# Also works with secondary axes:
p + scale_y_continuous(sec.axis=sec_axis(~5*., name='wt times 5')) +
coord_flex_cart(left=brackets_vertical(), bottom=capped_horizontal('right'),
right=capped_vertical('both', gap=0.02))
#> `geom_smooth()` using method = 'loess' and formula = 'y ~ x'
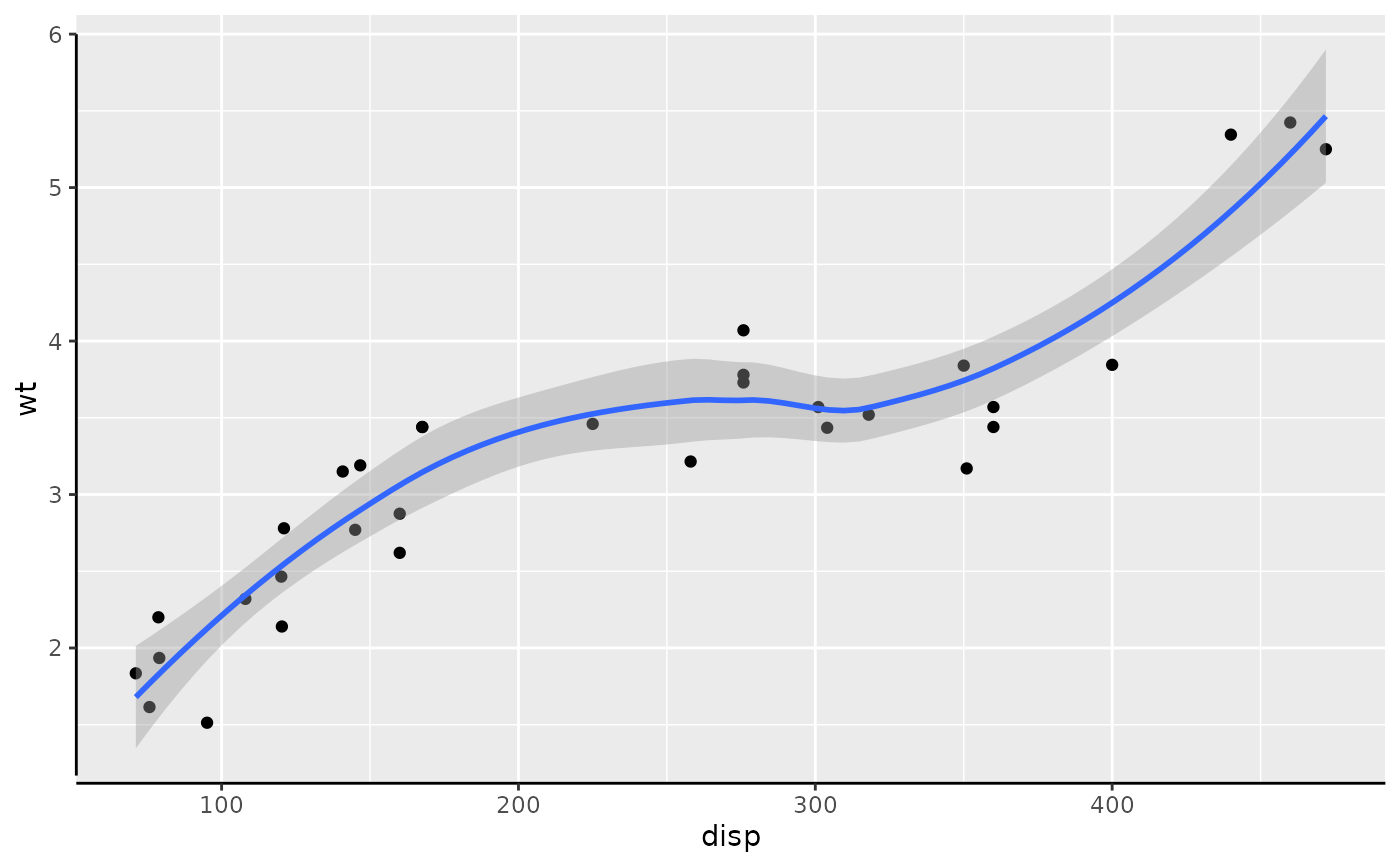
 # Supports the usual 'coord_fixed':
p + coord_flex_fixed(ratio=1.2, bottom=capped_horizontal('right'))
#> `geom_smooth()` using method = 'loess' and formula = 'y ~ x'
# Supports the usual 'coord_fixed':
p + coord_flex_fixed(ratio=1.2, bottom=capped_horizontal('right'))
#> `geom_smooth()` using method = 'loess' and formula = 'y ~ x'
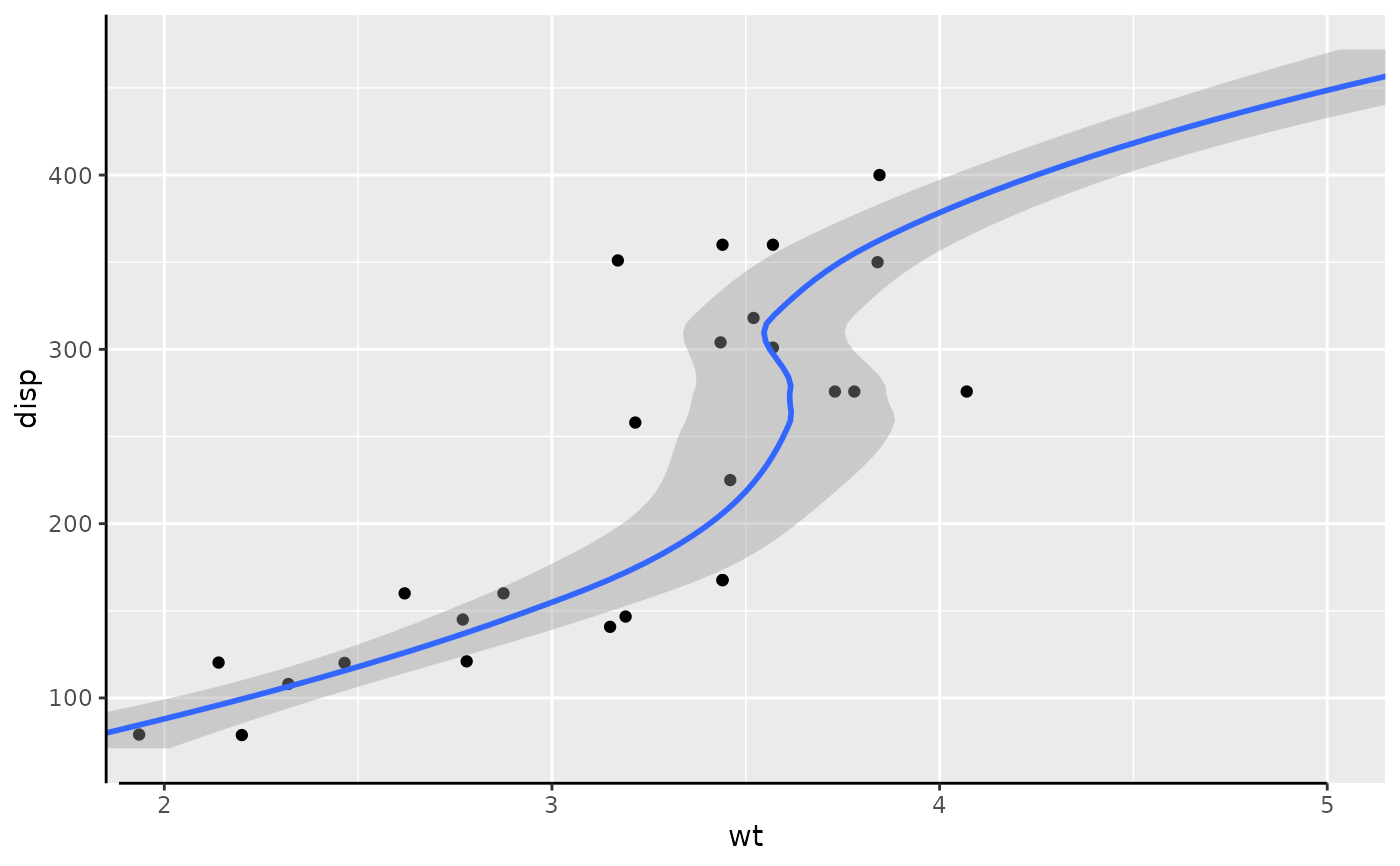
 # and coord_flip:
p + coord_flex_flip(ylim=c(2,5), bottom=capped_horizontal('right'))
#> `geom_smooth()` using method = 'loess' and formula = 'y ~ x'
# and coord_flip:
p + coord_flex_flip(ylim=c(2,5), bottom=capped_horizontal('right'))
#> `geom_smooth()` using method = 'loess' and formula = 'y ~ x'